GB/T 32085.2-2015 PDF EnglishUS$180.00 · In stock · Download in 9 seconds
GB/T 32085.2-2015: Automobiles -- Cabin air filter -- Part 2: Test for gas filtration Delivery: 9 seconds. True-PDF full-copy in English & invoice will be downloaded + auto-delivered via email. See step-by-step procedure Status: Valid
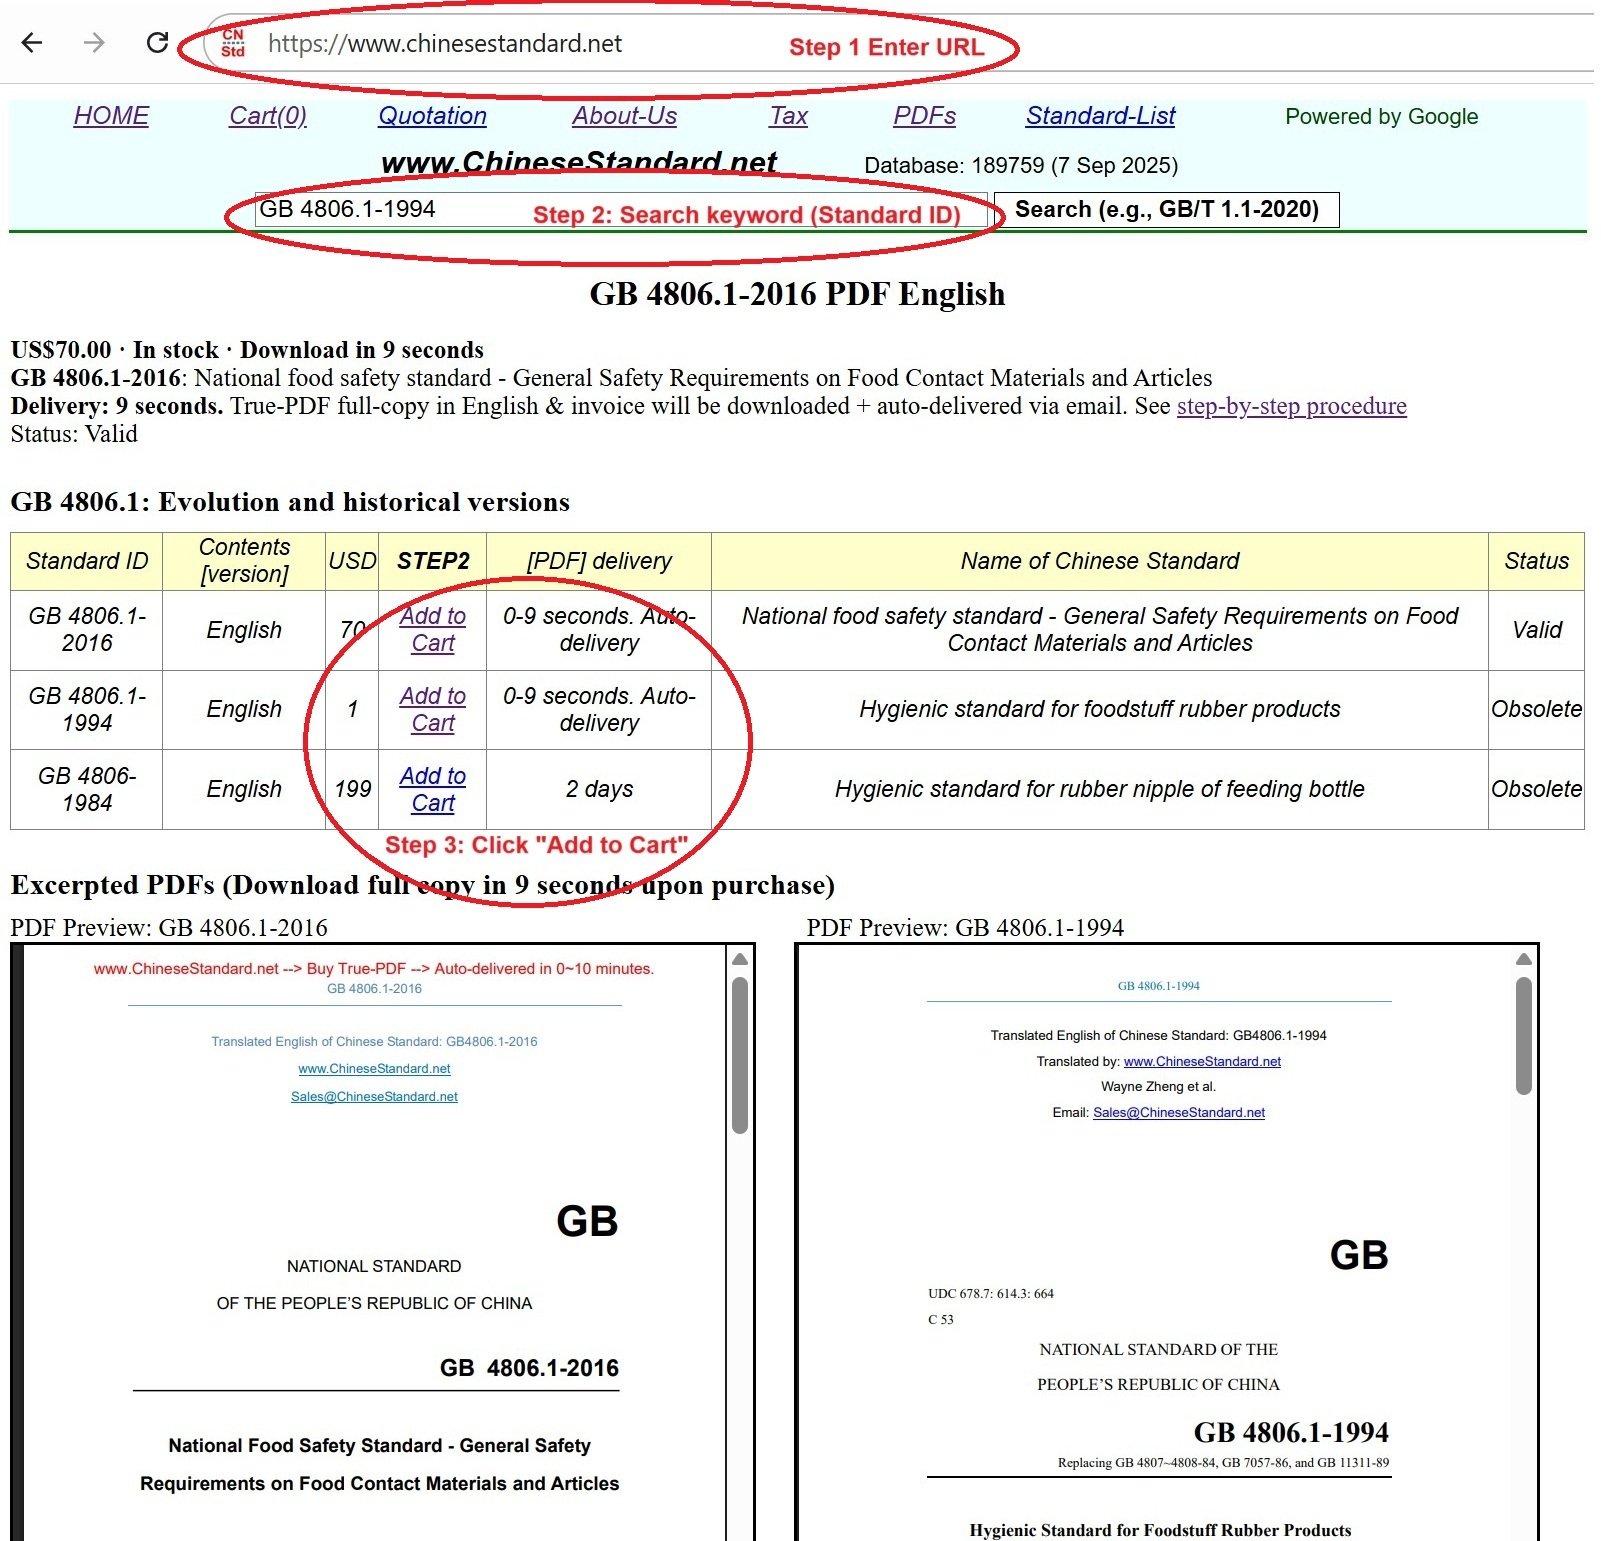
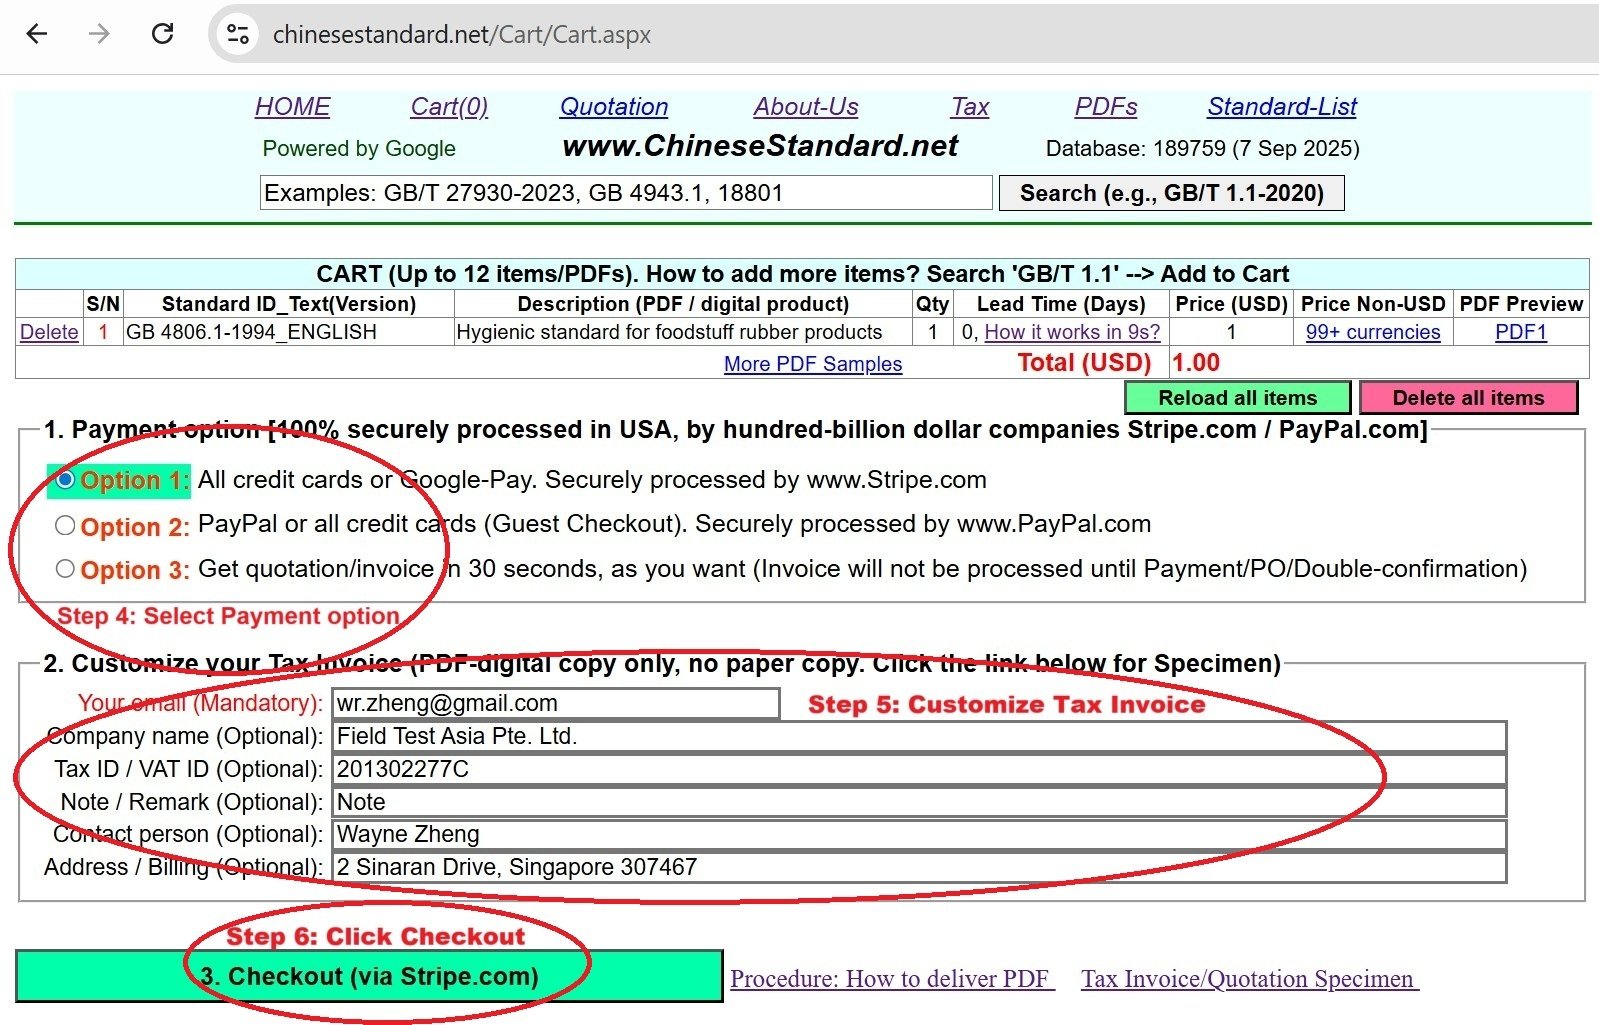
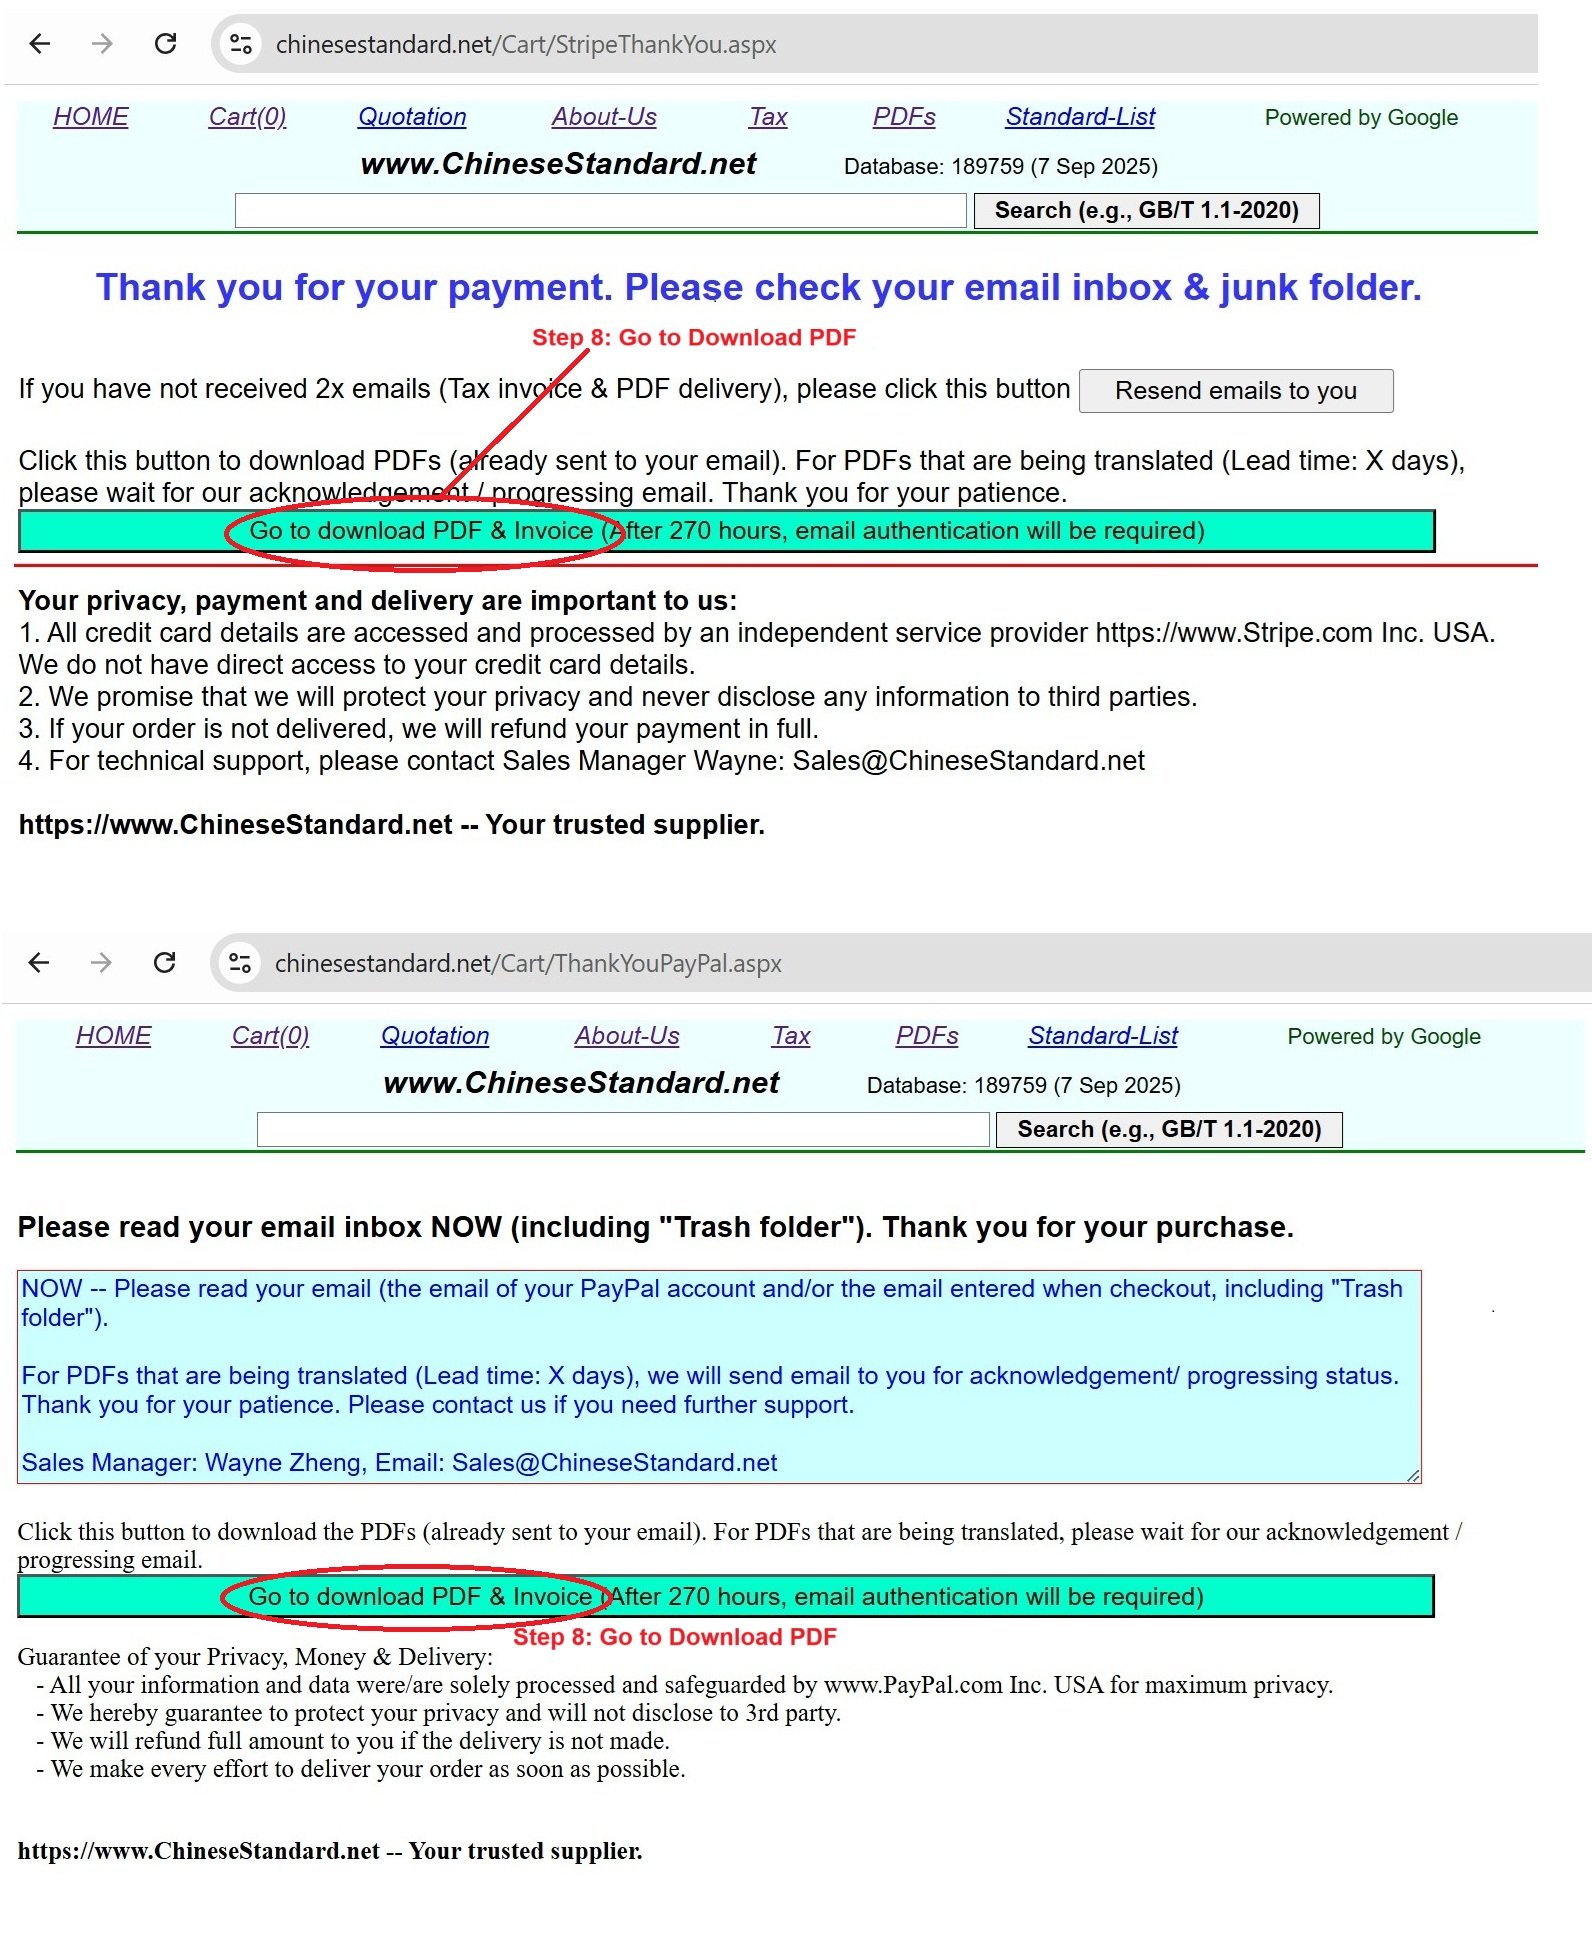
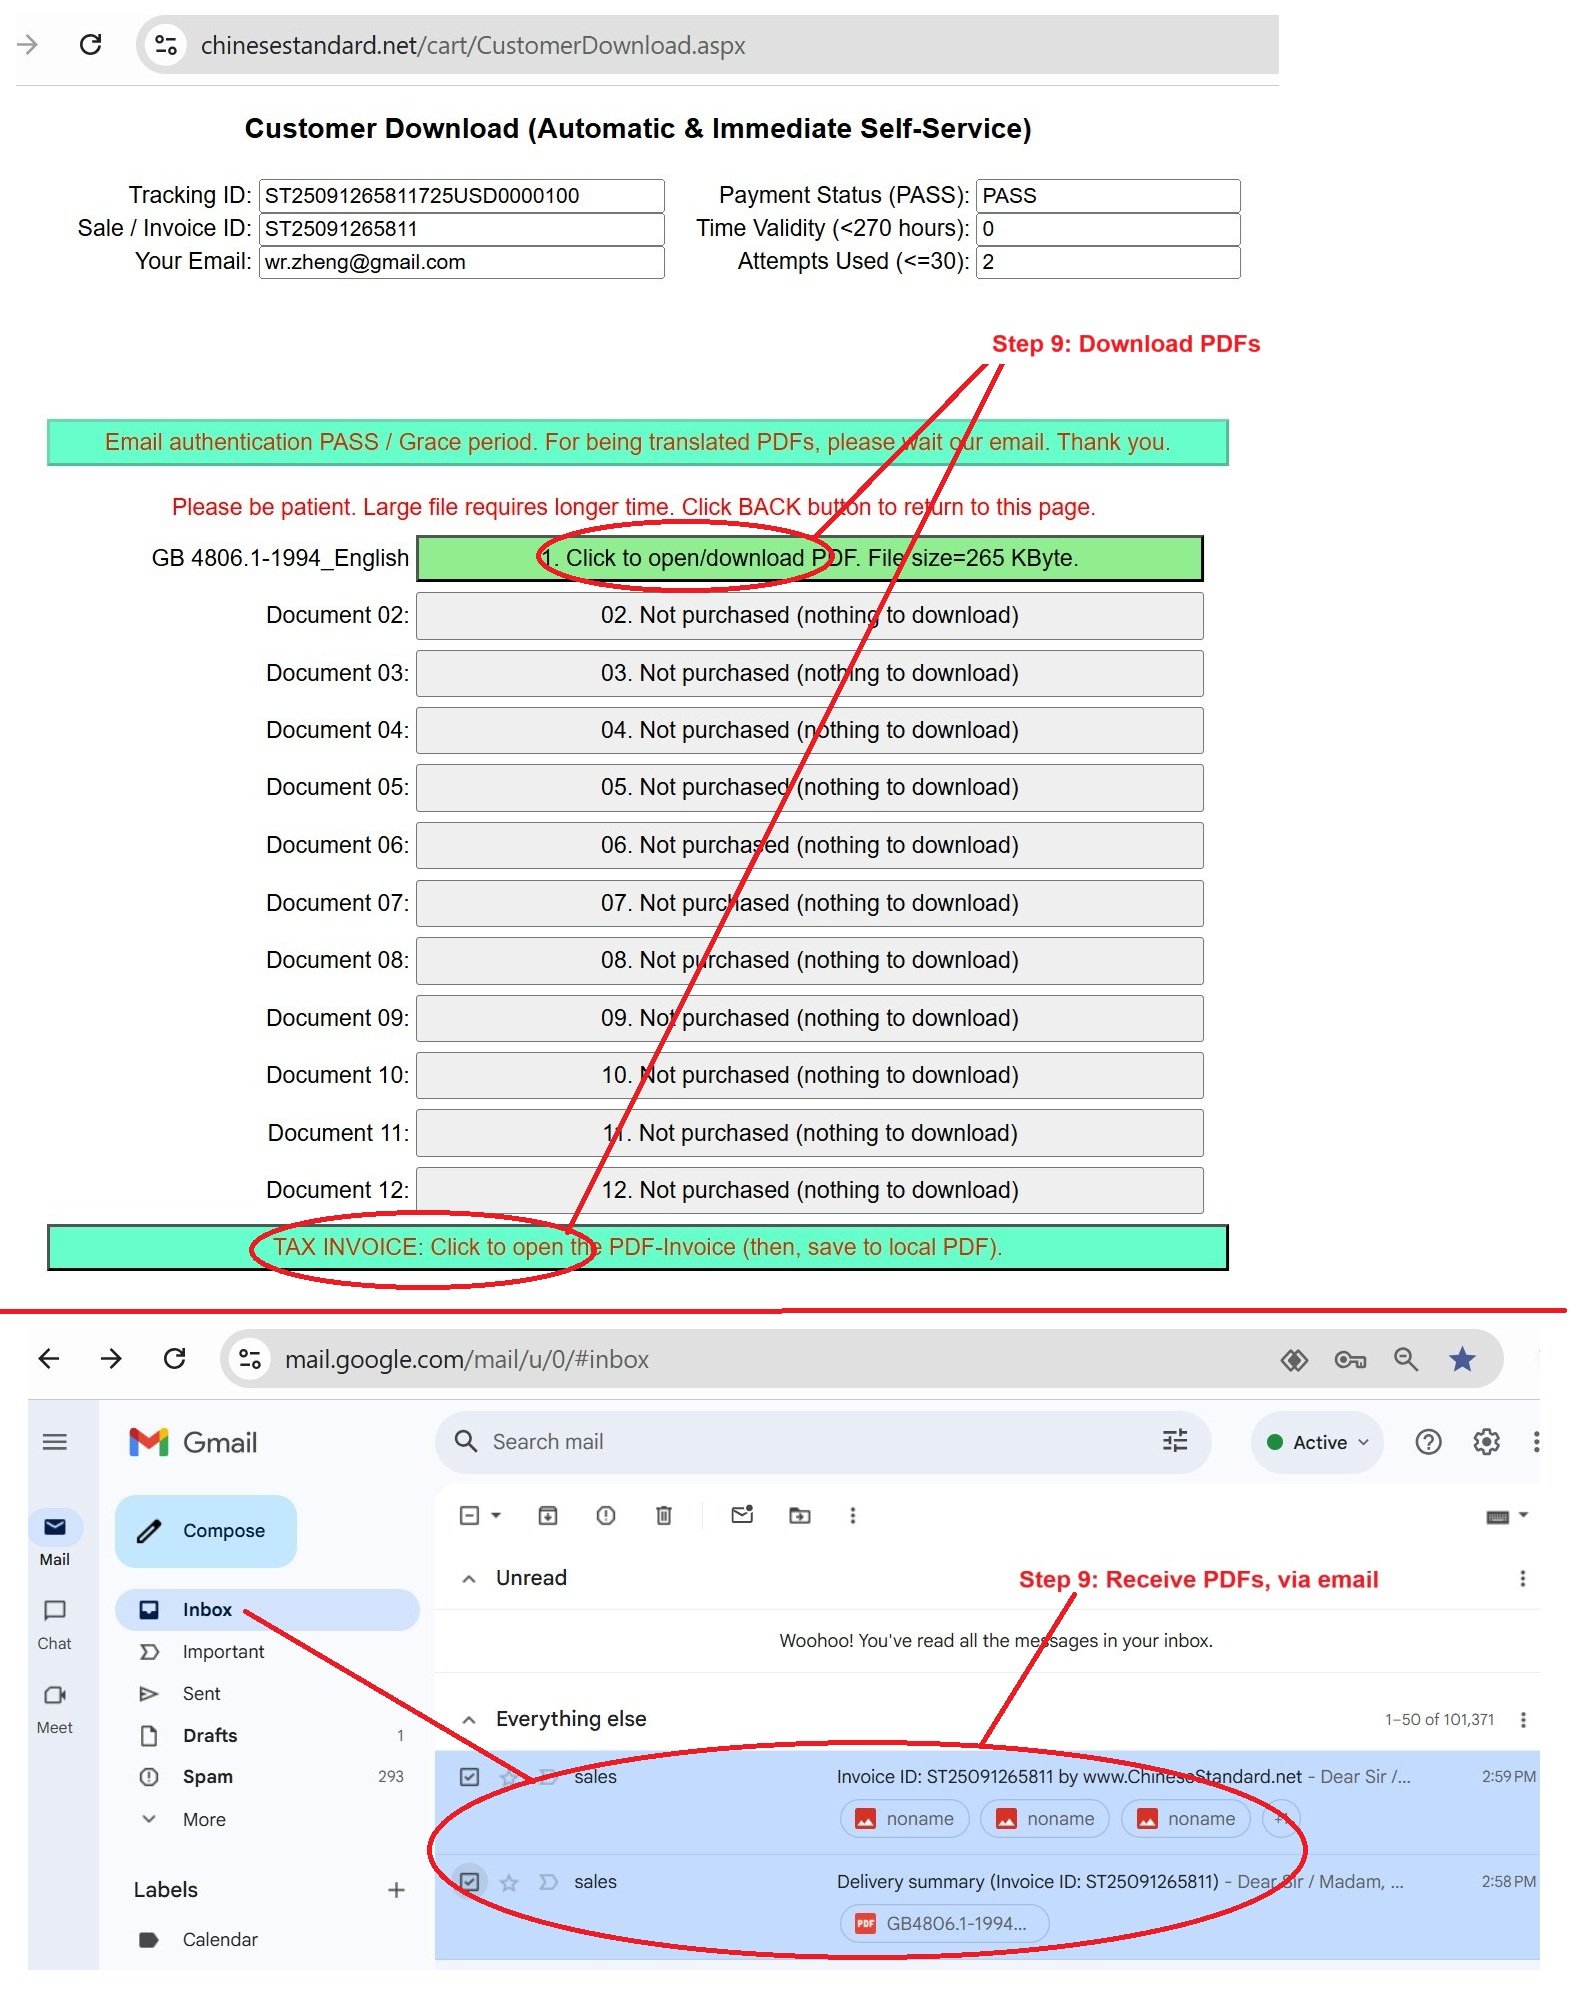
Similar standardsGB/T 32085.2-2015: Automobiles -- Cabin air filter -- Part 2: Test for gas filtration---This is an excerpt. Full copy of true-PDF in English version (including equations, symbols, images, flow-chart, tables, and figures etc.), auto-downloaded/delivered in 9 seconds, can be purchased online: https://www.ChineseStandard.net/PDF.aspx/GBT32085.2-2015Automobiles.Cabin air filter.Part 2. Test for gas filtration ICS 43.040.60 T26 National Standards of People's Republic of China Car air conditioner filter Part 2. Gas filtration test Part 2. Testforgasfiltration (ISO 11155-2.2009, Roadvehicles-Airfiltersforpassenger compartments-Part 2. Testforgaseousfiltration, IDT) Released on.2015-10-09 2016-03-01 implementation General Administration of Quality Supervision, Inspection and Quarantine of the People's Republic of China China National Standardization Administration issued Content Foreword III 1 Scope 1 2 Normative references 1 3 Terms and Definitions 1 4 Test accuracy 3 5 General conditions 4 6 Test Contaminants 4 7 test equipment 5 8 t0 determination and tlag application 6 9 Preparation of filters or filters for testing 7 10 Test Method 7 11 Confirmation of system status 8 12 Report 9 Appendix A (informative) Unit conversion and test gas and its concentration 10 Appendix B (informative) Calculation of adsorption efficiency 11 Appendix C (Normative Appendix) Specific definitions and calculations for t0 and tlag 12 Appendix D (Normative Appendix) Test Bench Construction 14 Appendix E (Normative Appendix) Determination of the amount of contamination 15 Reference 16 ForewordGB/T 32085 "Automotive Air Conditioner Filter" contains the following two parts. --- Part 1. Dust filtration test --- Part 2. Gas filtration test This part is the second part of GB/T 32085. This part is drafted in accordance with the rules given in GB/T 1.1-2009. This section uses the translation method equivalent to the international standard ISO 11155-2.2009 "Road cleaners for road vehicles" Part. Gas Filtration Test. The documents of our country that have a consistent correspondence with the international documents referenced in this part are as follows. ---GB/T 32085.1-2015 "Automotive air conditioning filter Part 1. Dust filtration test" (ISO /T S11155-1. 2001, MOD) This section has made the following editorial changes. --- In order to adapt to China's idioms, the standard name was changed to "Automotive Air Conditioner Filter Part 2. Gas Filtration Test". This part is under the jurisdiction of the National Automotive Standardization Technical Committee (SAC/TC114). This section drafted by. Changchun Ke Debao·Baoyu Filter Co., Ltd., Ke Debao·Baoyu (Suzhou) Non-woven Co., Ltd., Dongguan Haisha Filter Co., Ltd., Shenyang Xinke Precision Instrument Equipment Co., Ltd. The main drafters of this section. Hua Li, Wang Baifu, Bo Yuan, Ding Mingming, Wei Yi, Chen Yi Na, Gao Yang, Li Hefeng, and Qi Jinhui. Car air conditioner filter Part 2. Gas filtration test1 ScopeThis part of GB/T 32085 specifies several test methods for testing the dynamic adsorption performance of hazardous air gases in automotive air conditioning filters. This section is intended to test automotive air conditioning filters that reduce the concentration of harmful gases and odors from the external environment or internal circulation.2 Normative referencesThe following documents are indispensable for the application of this document. For dated references, only dated versions apply to this article. Pieces. For undated references, the latest edition (including all amendments) applies to this document. ISO /T S11155-1 Air cleaners for road vehicles - Part 1 . Dust filtration test (Roadvehicles- Airfiltersforpassengercompartments-Part 1.Testforparticulatefiltration) Road vehicles and internal combustion engine filters - Part 1. Definition of filter and filter components (Road vehiclesandinternalcombustionengines-Filtervocabulary-Part 1.Definitionsoffiltersandfilter Components) Road vehicles and internal combustion engine filters - Part 2. Definitions of filters and their components (Road vehiclesandinternalcombustionengines-Filtervocabulary-Part 2.Definitionsofcharacteristicsof Filtersandtheircomponents)3 Terms and definitionsThe following terms and definitions defined by ISO 11841-1 and ISO 11841-2 apply to this document. 3.1 Test air flow testairflowrate The volume of gas passing through the test channel per unit time. The unit is cubic meters per hour (m3/h). 3.2 Pressure drop ΔPd The static pressure difference between the upstream and downstream sides of the filter. The unit is Pa (Pa). 3.3 Contaminant contamination Harmful components scattered in the test gas. 3.4 Concentration concentration A mass (or volume) that is dispersed in another component. Note. Usually expressed as the mass of a component divided by the volume of the gas, such as milligrams per cubic meter (mg/m3); or the volume of the component divided by the volume of the gas, indicating For 10-6, see Appendix A. 3.5 Introducing airflow intofluentair A clean air stream used to dilute contaminants to produce a test gas. 3.6 Test gas chalengegas A gas that is used to test the performance of the filter after the airflow and test contaminants are uniformly mixed. 3.7 Test gas concentration chalengegasconcentration The mass (or volume) of the contaminant is tested in a unit volume of test gas under specified conditions. Note. expressed in milligrams per cubic meter (mg/m3) or 10-6. See Appendix A. 3.8 Test gas pollutant quality testcontaminantmass The total mass of test contaminants acting on the filter. Note. expressed in milligrams (mg). 3.9 Influent concentration C1 The concentration of contaminants in the test gas upstream of the filter. Note. expressed in milligrams per cubic meter (mg/m3) or 10-6. See Appendix A. 3.10 Outflow gas concentration effluentconcentration C2 The concentration of contaminants in the test gas downstream of the filter. Note. expressed in milligrams per cubic meter (mg/m3) or 10-6. See Appendix A. 3.11 Adsorption efficiency The amount of contaminant removed or reduced by the filter divided by the total amount of contaminant directly acting on the filter is the adsorption of the filter effectiveness. 3.11.1 1 minute efficiency 1minefficiency The adsorption efficiency measured from 1 hour at zero time (t0). 3.11.2 2 minutes efficiency 2minefficiency The adsorption efficiency measured from zero time (t0) for 2 min. 3.11.3 5 minutes efficiency 5minefficiency The adsorption efficiency measured from zero time (t0) for 5 min. 3.12 Penetration rate The amount of contaminant that passes through the filter accounts for the proportion of the total amount of contaminant acting on the filter. 3.13 Zero time zero T0 Zero time calculated from the upward curve of the relationship between gas penetration and time. See Chapter 7 and Appendix C. Note. Once the curve is determined, zero time (t0) can be obtained by calculation. All adsorption efficiency and breakthrough data can be calculated from the determined t0. 3.14 Start time startoftesttime Tstart The time at which the test gas was introduced into the test system. 3.15 Lag time lagtime Tlag The difference between tstart and t0. Note. See Appendix C. 3.16 Termination time endoftesttime Tf The time or specified time to achieve the user-specified adsorption efficiency (usually 5%). 3.17 Test total time totaltesttime Starting from t0, the test gas is applied to the filter for the entire time. 3.18 Contamination capacity Mc The mass of contaminants adsorbed by the filter from the test gas stream throughout the test period. Note. Usually expressed in milligrams (mg). 3.19 Desorption Release previously captured contaminants from the test filter.4 test accuracy4.1 Flow Monitor The measuring instrument shall be calibrated for test gas or contaminated gas. The required accuracy is ±3% of the test value. 4.2 Pressure monitor The differential pressure is required to be accurate to ±2% of the test value. 4.3 Temperature Temperature requirements are accurate to ±0.5 °C. 4.4 Relative humidity Relative humidity requirements are accurate to ±2%. 4.5 Test gas monitoring accuracy Monitoring of the concentration of test gases (such as n-butane, toluene or sulfur dioxide) is precisely required to be accurate to ±3%.5 general conditions5.1 Gas condition The temperature of the test gas after mixing should be (23 ± 3) ° C, and the relative humidity should be (50 ± 2)%. 5.2 Introducing air cleanliness The volume of organic pollutants introduced into the air shall not exceed 2 × 10⁻⁶ of the total amount (one millionth of volume, ie 10-6). It is recommended to use a high efficiency filter (HEPA) (see EN779) to remove suspended particles introduced into the air. 5.3 Stability of test gas concentration The deviation of the test gas concentration is required to not exceed ± 3% of the set value throughout the experiment.6 Test contaminants6.1 Forced Contaminants These mandatory test contaminants were chosen because they deteriorate the quality of the air when the concentration in the air is high, or Because they provide a useful mark for a particular purification system. The purity and concentration of the test contaminants are shown in Table 1. Table 1 Test Contaminants Test contaminant minimum purity /% concentration Setting value/10-6b conversion coefficient c N-butane a 99.5 80±8 2.39 Toluene 99.5 80±8 3.79 a The rationale for the selection is that n-butane provides a test method that is effective and easy to implement for activated carbon adsorption systems. N-butane for testing non-activated carbon suction The attached system is of limited value and therefore other alternative contaminants should be used. b For conversion to international standard units, see Appendix A. c Allows conversion to mg/m3 at 23 ° C and 101 kPa atmospheric pressure. 6.2 Optional Contaminants Other contaminants may also be selected based on the agreement between the user and the manufacturer. Recommended contaminants and their purity and concentration As shown in table 2. Table 2 Selected test contaminants Test contaminant minimum purity /% concentration Setting value/10-6b conversion coefficient c SO2a 99.5 30±3 2.64 a The reason for selection is that it represents the performance of acid gas for carbon-based adsorption systems. b For conversion to international standard units, see Appendix A. c Allows conversion to mg/m3 at 23 ° C and 101 kPa atmospheric pressure. 6.3 Other pollutants See Appendix A for other pollutants. The choice of other contaminants is usually for specific application purposes, and the specific choice is made by the filter user. And the manufacturer is set.7 test equipment7.1 Overall layout The test bench shall comply with the requirements listed in 7.2~7.7. Figure D.1 shows an example of the layout of a test rig. Individual and experimental in the system All parts in contact with the gas should be made of corrosion-resistant materials to minimize the error caused by the adsorption effect on the surface of the part. The test bench should include Equipment and instruments for gas flow supply, flow detection, differential pressure detection, contaminant injection, sampling, and sample analysis. The test bench preferably operates in a negative pressure mode where the fan or fan is mounted downstream of the test sample. Such a construction even if the test channel The presence of a leak also prevents the test gas from entering the surrounding environment. In addition, due to the possibility of systematic errors in the contact of the test gas with the fan Can be excluded. For the above reasons, the selection of the negative pressure mode is most suitable, however, if the system designed according to the positive pressure mode can satisfy The requirements of 7.2~7.7 are equally acceptable. 7.2 Test Bench Performance The performance of the test bench shall be verified as part of the entire test system (including the test bench and associated equipment) as specified in Chapter 11. Such verification should be repeated when there is a large change in the test state (eg flow) or the configuration of the test bench (eg gas mixing device or fixture) get on. The test equipment shall be calibrated according to the method and calibration cycle recommended by the manufacturer. 7.3 Air supply The introduction of airflow requirements is specified in 5.1 and 5.2 (control temperature, humidity and purification). The system should be maintained throughout the testing process The ability of this state and the ability to provide and maintain the airflow required by the user. 7.4 Test channel In general, the test channel should be designed to minimize the amount of adsorption of the test contaminants and allow the airflow to reach the test evenly. The surface of the sample. To achieve this, perforated sheets, mixers or converters and the like can be used. Injected test contaminants and airflow in the channel The mix should be strictly followed and confirmed. In general, test channels similar to those described in ISO /T S11155-1 can meet the above requirements. However, ISO /T S11155-1 Some design details of the processing and detection of particles, although not affecting the treatment and detection of gases, but not in this test have to. 7.5 The occurrence and supply of pollutants Test contaminants that are already in a gaseous state under test conditions can be supplied directly to the test channel. Test contaminants (such as toluene) that are in a liquid state under the test conditions should be volatilized before being injected into the channel. This can be heated Or ultrasound and other methods to achieve. Should meet the temperature requirements of 5.1. In addition, appropriate means (such as heating, tubular design, etc.) should be used. Avoid testing condensation of contaminants, especially near the contaminant injection section. Test contaminants produced by chemical reactions, such as NO2, should be produced in a separate chamber and then injected into the test channel to Ensure the chemical purity of the contaminants. 7.6 Analysis of sampling and test gases A test gas sample was taken at the upstream and downstream of the filter under test. The sampling point location should ensure that a representative sample can be collected. This should Confirm according to Chapter 11. A quantitative (preferably independently controlled) flow is drawn from the test channel leading to the gas analyzer. The frequency of sampling should be sufficient to draw a meaningful adsorption efficiency curve. It is recommended to sample every 10s or use gas. The fastest frequency allowed by the body analyzer. For longer test times, if the plotted adsorption efficiency curve is good enough, you can choose lower Sampling frequency. 7.7 Test equipment composition 7.7.1 Flow Monitor The test instrument shall be calibrated against the test gas and shall have the accuracy specified in 4.1. 7.7.2 Pressure monitor The pressure difference should be monitored using a high-precision pressure sensor or an electronic pressure sensor with an accuracy of 4.2. 7.7.3 Temperature The temperature should be monitored and meet the accuracy specified in 4.3. 7.7.4 Relative humidity The relative humidity should be monitored and meet the accuracy specified in 4.4. 7.7.5 Data logging Data such as temperature, atmospheric pressure, differential pressure and relative humidity should be recorded regularly. 7.7.6 Gas Analyzer The range of the gas analyzer should cover the concentration range of each specific test gas. Should be tested within 5% of the upstream concentration of the sample Gas monitoring accuracy. The calibration function should be determined by the full concentration of each test gas. The accuracy of the test shall meet the requirements of 4.5. The analyzer's signal-to-noise ratio (S/N) requirement is greater than 3. It is recommended that the gas analyzer be sampled at a frequency of 10 s or enough to plot a meaningful frequency of the adsorption efficiency curve. filter The concentration C2 of the test gas downstream of the cleaner is sampled at this frequency. For some test conditions where the downstream concentration changes little In this case, the sampling frequency can be reduced to 1 min as long as the downstream concentration change value meets the required accuracy within the corresponding time. This especially It is suitable when the change in downstream concentration has fallen below the lower monitoring limit of the analyzer. The sampling frequency should be increased as early as possible to 10s or Higher to fully record the growth of downstream concentrations during this time. And the test phase to reduce the sampling frequency should be in another separate Determined in the test. 8 t0 determination and application of tlag Follow the procedure below. a) the concentration and flow rate of the steady test gas inflow; b) direct gas to the exhaust; c) install an empty sample holder in the test channel; d) return the instrument to a zero concentration reading; e) transporting gas into the test bench (tstart); f) record the gas concentration at the highest sampling frequency allowed by the instrument; sample at least 3 to 5 times between zero and maximum gas concentration; g) increasing the concentration of the gas to the maximum concentration of the test gas; h) returning the gas to the exhaust, which completes a test; i) calculate the slope at 50% penetration of the gas curve (see Appendix C); j) calculate t0 and tlag (see Appendix C); k) In order to improve the test accuracy, repeat the test several times under the same conditions; l) In the subsequent gas performance test, tlag is applied to determine the time interval between tstart and t0; the determination of the penetration time should be started by t0 Start timing. The reading of the test gas concentration at point t0 may not be zero.9 Test filter or filter preparationThe test filter was dried until the mass was stable within 2%. Air conditioner with new filter at 50% relative humidity and 23 °C Store for at least 14 hours, then place the filter in the test stand and pass the filter for at least 15 minutes at a clean, stable flow rate. 10 test methods 10.1 Purpose of the test The purpose of these tests is to determine the removal efficiency and containment of harmful gases or volatiles by the filter using the equipment described in Chapter 7. Quantity, desorption characteristics (optional) and airflow resistance. The test system should be confirmed first before using these methods for testing (see Chapter 11). 10.2 Airflow resistance This test is used to determine the resistance characteristics of a clean filter in a clean air flow. The flow-pressure drop curve is at the rated flow. Obtained by measuring the pressure drop at 25%, 50%, 75%, and 100% of the amount. The differential pressure test shall be carried out in accordance with ISO /T S11155-1. 10.3 Preparation of test gas Ensure that the concentration and flow of the test gas meets the test by introducing the contaminated gas or vapour into the clean air stream and monitoring and controlling it. The required concentration, purity, and nominal flow rate of the sample. 10.4 Adsorption efficiency/penetration rate 10.4.1 Overview The purpose of the test is to determine the ability of the filter to adsorb contaminants in the test gas. The test is in accordance with the provisions of Chapters 5 and 6. The flow rate and contaminant conditions are determined. 10.4.2 Determination of adsorption efficiency According to the requirements of Chapter 9, the test is carried out using a new, calibrated filter. Using the test concentration of the test contaminant at the specified flow rate, Test the sample under temperature and humidity conditions. The test should be carried out until the gas concentration downstream of the sample reaches 95% of the upstream gas concentration or Until the predetermined time. 10.4.3 Adsorption efficiency test procedure Follow the procedure below. a) Load the pre-calibrated filter into the test bench, set the test flow and check the temperature and relative humidity; b) continuously inject the test gas to the desired concentration, let it flow through the test sample to start the test; record the test start time; c) detecting the concentration of the introduced test gas and continuously monitoring it; d) detecting the concentration of gas in the gas stream downstream of the sample at the time intervals specified in 7.7.6; e) continuously detect the gas concentration until the gas concentration downstream of the sample reaches a certain percentage of the upstream concentration (typically 95%) or After a predetermined test time; record the test termination time; f) stop injecting contaminants and gas supply, and terminate the test; g) Calculate the adsorption efficiency/penetration rate from the concentration data. 10.5 Determining the amount of dirt The amount of dirt in the filter can be obtained by integrating the adsorption efficiency curve (see Appendix E). 10.6 Data and Analysis Data records recorded in digital form are represented in the form of graphs and tables. Required raw data, if measured conditions and standard bars When there is a deviation, it can be corrected by the regression method. 10.7 Determining Desorption The introduction of the test gas is stopped after the completion of the penetration test as described in 10.4. Confirm that the test gas concentration upstream of the sample is below the specified 5% of the concentration. The curve of gas concentration downstream of the sample was monitored until the gas concentration decreased to 5% of the specified concentration. 11 Confirmation of system status 11.1 Uniformity of airflow The uniformity of the gas flow shall be in accordance with the requirements of ISO /T S11155-1. 11.2 Verify the stability of the test gas (without the test sample) The purpose of the verification test is to ensure that the concentration of the test gas passing through the filter remains stable and that the amount of gas adsorbed by the filter holder The smallest. The verification test shall be carried out at the minimum and maximum flow rates that may be used at the test bench, and at the specified test concentration and only for the specified concentration 10% of the time. a) Establish test airflow, temperature and relative humidity without installing a filter on the test bench. b) Start injecting the test gas at the desired concentration. c) Take five points at the opening of the filter housing/space for gas concentration readings. The first point is at the center of the open face, His four points are taken from the center point and the edge of the opening, respectively, 90° apart (see Figure 1). All sampling points should be located On the same plane of the filter. Sample at least three times at each sample point and take the average as the reading for that point. d) Compare the five average concentrations (upstream and downstream of the sample). The difference between these averages should be no more than 5%. Description. 1---Filter assembly plane opening; 2---The inside area of the filter assembly plane; 3---center sampling position; 4--- Off-center sampling position. Figure 1 Reading position of test gas concentration 12 report The test report should contain at least the following information. a) General information. 1) Test date; 2) the name of the laboratory and the technician performing the operation; 3) The test method, if it is different from the standard test method, should be described in detail; 4) A clear indication of the test sample; 5) the surface area of the sample (m2) and the thickness of the filter material (mm); 6) temperature (°C) and relative humidity (%) of the test gas; 7) Flow rate (m3/h); 8) Contaminants (which should be used, optional and other specific gases), ie gas type and concentration (expressed in mg/m3); 9) Pretreatment of the sample; 10) Atmospheric and system pressures upstream of the sample and at the flow meter. b) Test results. 1) the pressure drop (in Pa) at the test flow rate; 2) adsorption efficiency-time distribution curve; 3) Adsorption efficiency (%) after time t, the specific t can be specified by the customer; to check the efficiency of the following time interval. --- n-butane. 1min; ---toluene. 2min; ---Sulphur dioxide. 5min; 4) The amount of contamination (the area of the portion surrounded by the adsorption efficiency and the test time curve), expressed in milligrams (mg); 5) Desorption data.Appendix A(informative appendix) Unit conversion and test gas and its concentration A.1 Unit conversion. Equation (A.1) is used to determine the conversion factor F, F can be used to convert the plot ratio represented by 10-6 into mass expressed in mg/m3 concentration. F= M ×p R×T×10 (A.1) In the formula. M --- molar mass in grams per mole (g/mol); p --- pressure in hundred Pascals, in units of hundred Pascals (hPa); R --- gas molar constant 8.314, the unit is coke per mole Kelvin [J/(mol · K)]; T --- Absolute temperature in Kelvin (K). A.2 Test gas and its concentration are shown in Table A.1. Table A.1 Test gas and its concentration (temperature T=23°C, pressure p=101.3kPa) Test gas molecular formula substitution concentration/10-6 Molar mass / (g/mol) Conversion factor Butane C4H10 Volatile Organic Compound (VOC) 80 58.12 2.39 Toluene C7H8 Volatile Organic Compound (VOC) 80 92.14 3.79 Fluorine (phenylene) benzene C6H5F benzene 80 96.10 3.95 Acetaldehyde C2H4O Formaldehyde 30 44.50 1.81 Hydrogen sulfide H2S Corrosion odor 0.4 34.08 1.40 Ammonia NH3 corrosion odor 30 17.03 0.70 Sulfur dioxide SO2 30 64.06 2.64 Hydrochloric acid HCl 36.46 1.50 Nitric acid HNO3 63.01 2.59 Nitric oxide NO 30 30.10 1.23 Nitrogen dioxide NO2 30 46.01 1.89 Ozone O3 48.00 1.97 Nitrogen N2 28.01 1.15 Oxygen O2 32.00 1.32 Example. 1 volume concentration (10-6) of butane (C4H10) at 23 ° C and 101.3 kPa, corresponding to a mass concentration of 2.39 mg/m 3 .Appendix B(informative appendix) Calculation of adsorption efficiency The adsorption efficiency of the filter is calculated as a percentage as shown in equation (B.1). E= C1-C2 C1 × 100% (B.1) In the formula. E --- adsorption efficiency; C1 --- Influent gas pollutant concentration; C2 --- Outflow gas pollutant concentration. Note. penetration/permeability = 100% - E.Appendix C(normative appendix) Specific definitions and calculations for t0 and tlag The lag time tlag means that the test system detects that the test gas reaches the maximum gas concentration without installing the filter for testing. The time that was experienced. The length of this time is related to the actual test bench structure, air flow, test gas type and concentration. Due to these differences, the start time (tstart) of the test cannot be simply used as the calculation of the adsorptio... ......Source: Above contents are excerpted from the full-copy PDF -- translated/reviewed by: www.ChineseStandard.net / Wayne Zheng et al. Tips & Frequently Asked Questions:Question 1: How long will the true-PDF of English version of GB/T 32085.2-2015 be delivered?Answer: The full copy PDF of English version of GB/T 32085.2-2015 can be downloaded in 9 seconds, and it will also be emailed to you in 9 seconds (double mechanisms to ensure the delivery reliably), with PDF-invoice.Question 2: Can I share the purchased PDF of GB/T 32085.2-2015_English with my colleagues?Answer: Yes. The purchased PDF of GB/T 32085.2-2015_English will be deemed to be sold to your employer/organization who actually paid for it, including your colleagues and your employer's intranet.Question 3: Does the price include tax/VAT?Answer: Yes. Our tax invoice, downloaded/delivered in 9 seconds, includes all tax/VAT and complies with 100+ countries' tax regulations (tax exempted in 100+ countries) -- See Avoidance of Double Taxation Agreements (DTAs): List of DTAs signed between Singapore and 100+ countriesQuestion 4: Do you accept my currency other than USD?Answer: Yes. www.ChineseStandard.us -- GB/T 32085.2-2015 -- Click this link and select your country/currency to pay, the exact amount in your currency will be printed on the invoice. Full PDF will also be downloaded/emailed in 9 seconds.How to buy and download a true PDF of English version of GB/T 32085.2-2015?A step-by-step guide to download PDF of GB/T 32085.2-2015_EnglishStep 1: Visit website https://www.ChineseStandard.net (Pay in USD), or https://www.ChineseStandard.us (Pay in any currencies such as Euro, KRW, JPY, AUD).Step 2: Search keyword "GB/T 32085.2-2015". Step 3: Click "Add to Cart". If multiple PDFs are required, repeat steps 2 and 3 to add up to 12 PDFs to cart. Step 4: Select payment option (Via payment agents Stripe or PayPal). Step 5: Customize Tax Invoice -- Fill up your email etc. Step 6: Click "Checkout". Step 7: Make payment by credit card, PayPal, Google Pay etc. After the payment is completed and in 9 seconds, you will receive 2 emails attached with the purchased PDFs and PDF-invoice, respectively. Step 8: Optional -- Go to download PDF. Step 9: Optional -- Click Open/Download PDF to download PDFs and invoice. See screenshots for above steps: Steps 1~3 Steps 4~6 Step 7 Step 8 Step 9 |