GB/T 36081-2018 PDF EnglishUS$250.00 · In stock · Download in 9 seconds
GB/T 36081-2018: Nanotechnology - Characterization of CdSe quantum dot nanocrystal - Fluorescence spectroscopy Delivery: 9 seconds. True-PDF full-copy in English & invoice will be downloaded + auto-delivered via email. See step-by-step procedure Status: Valid
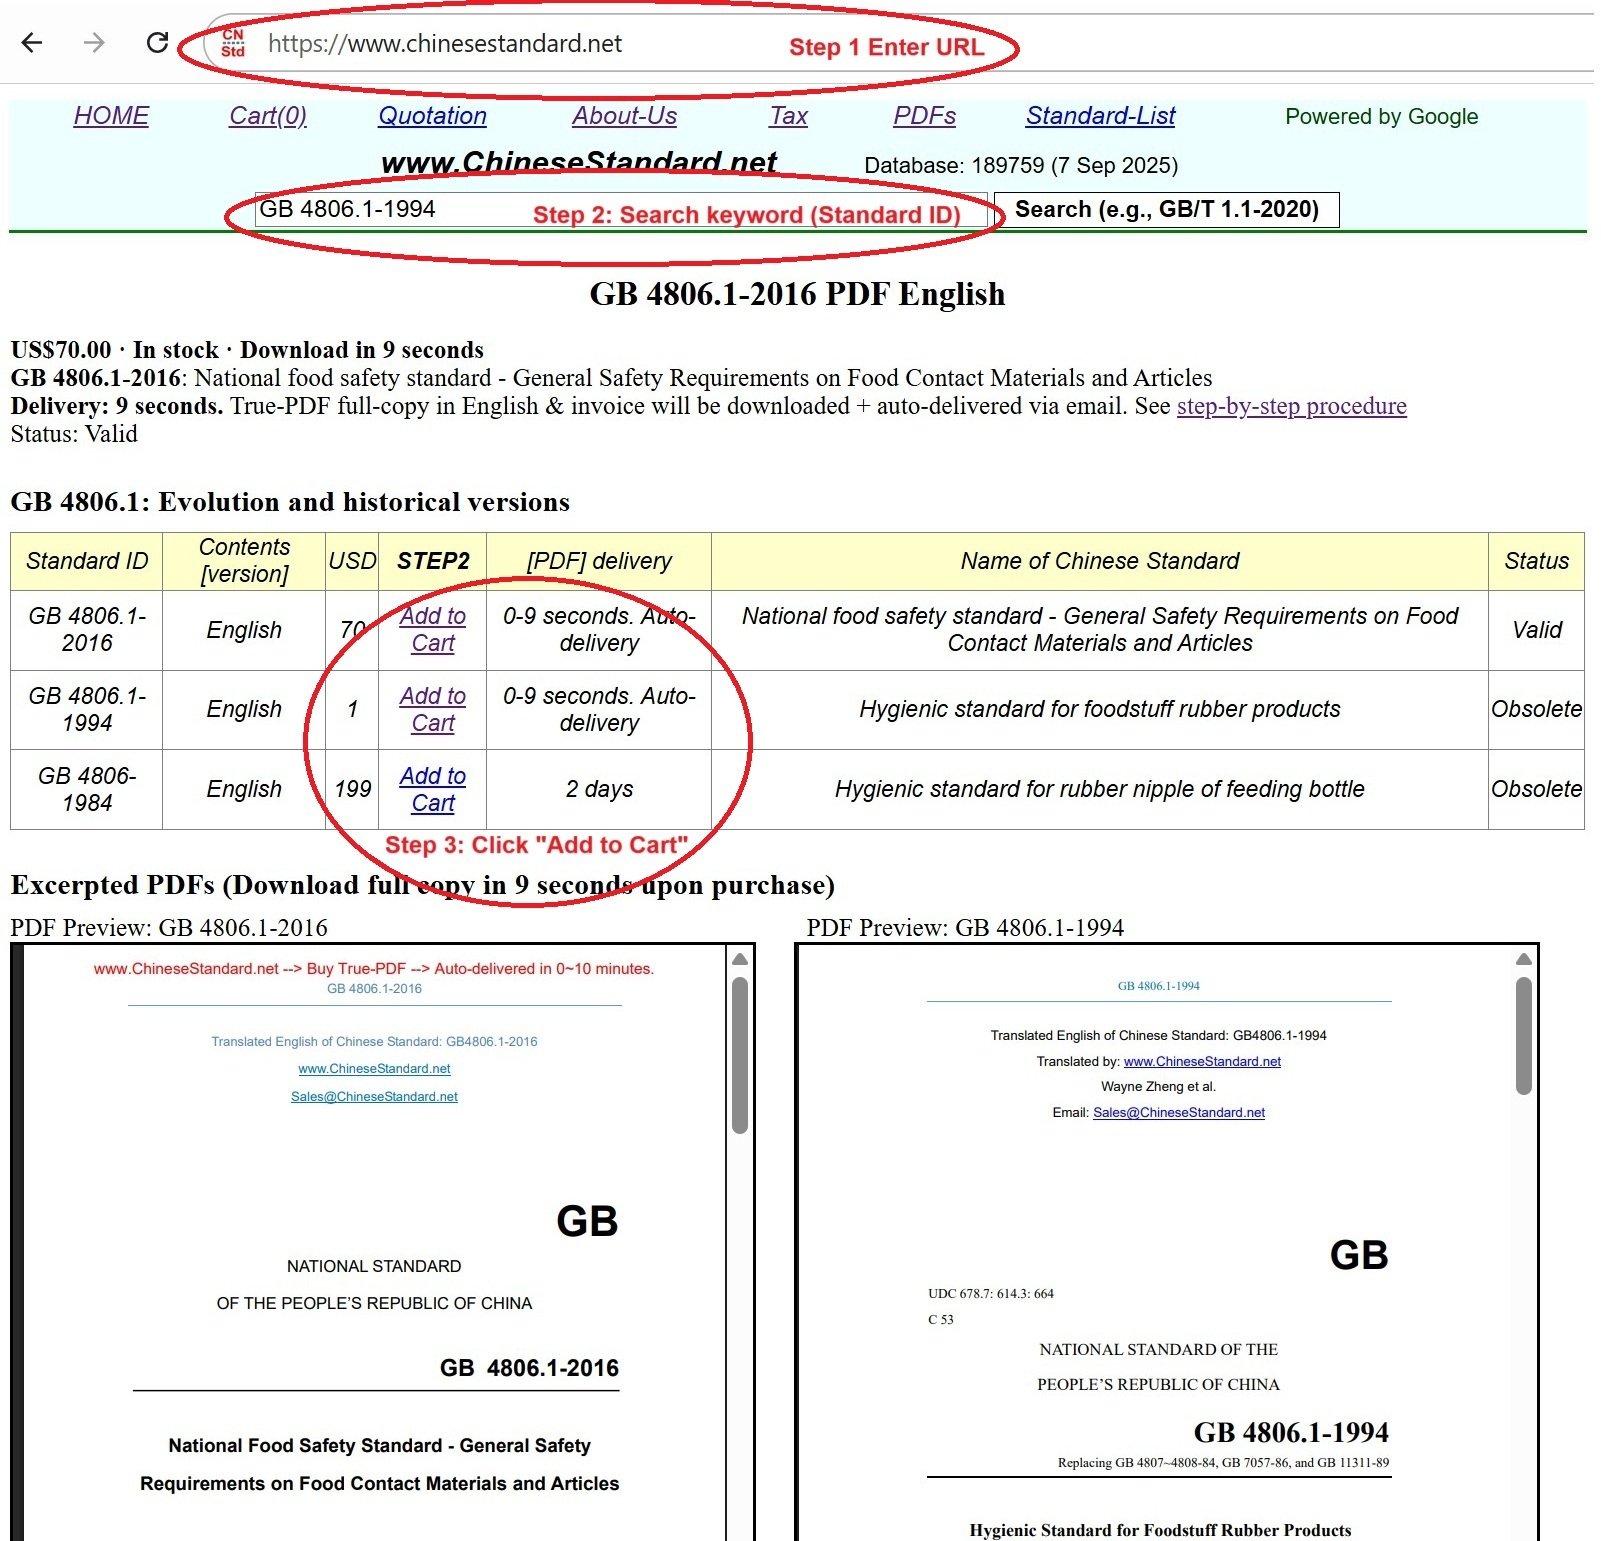
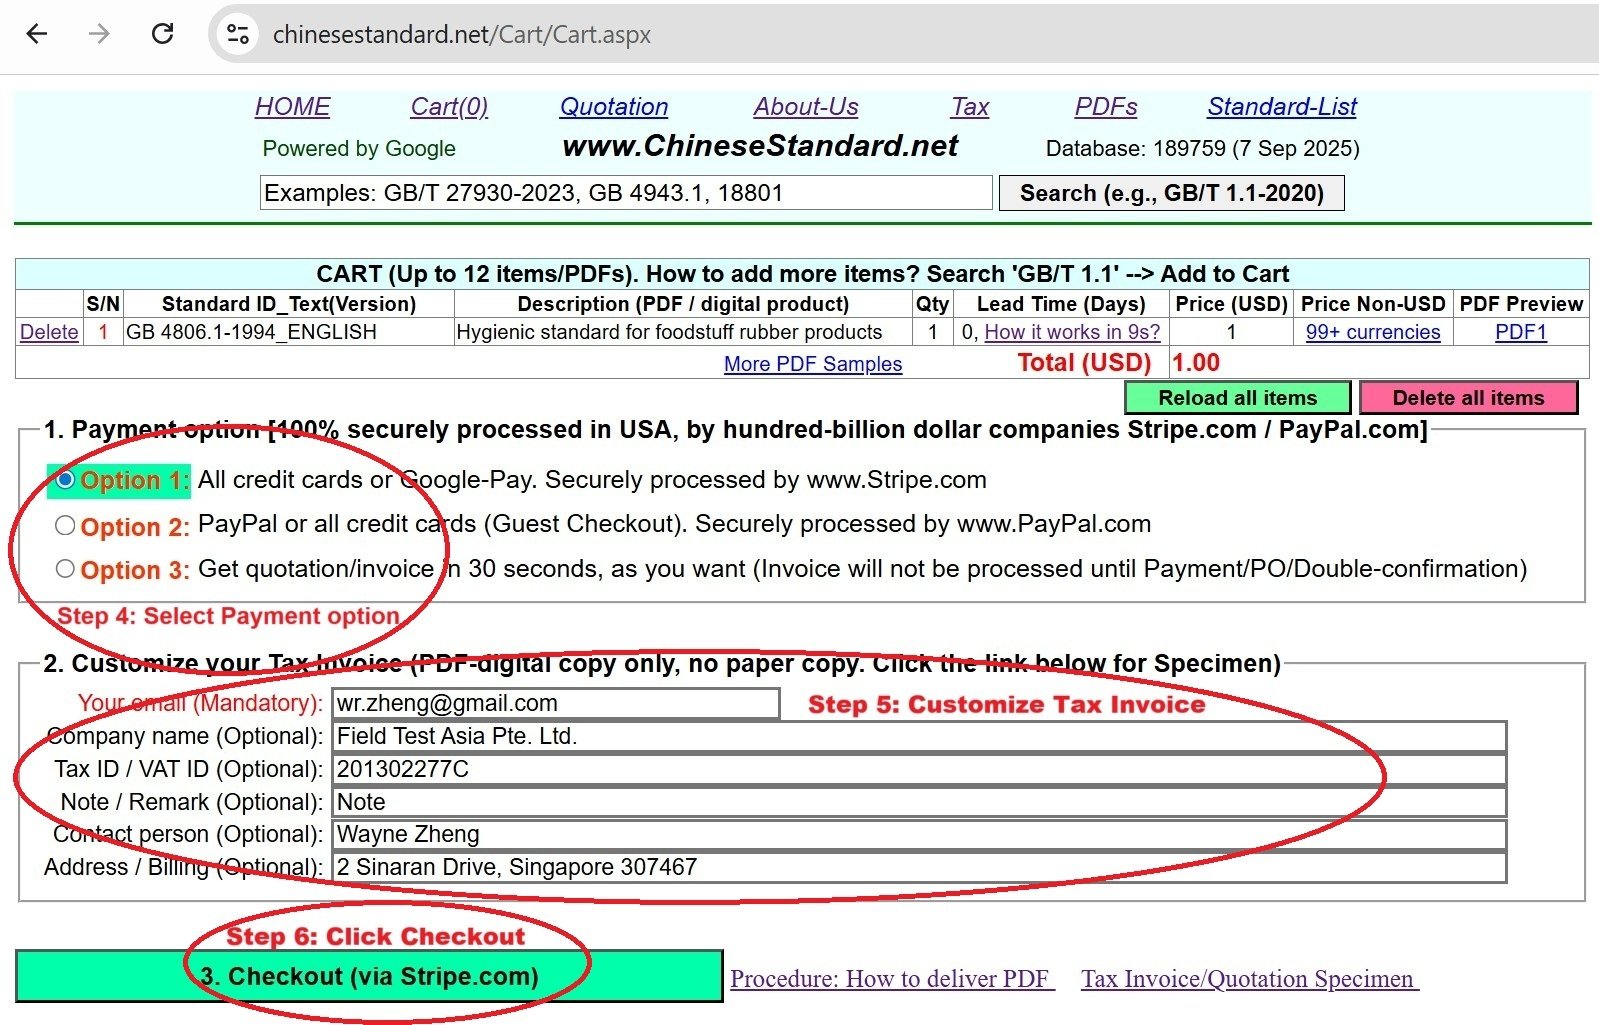
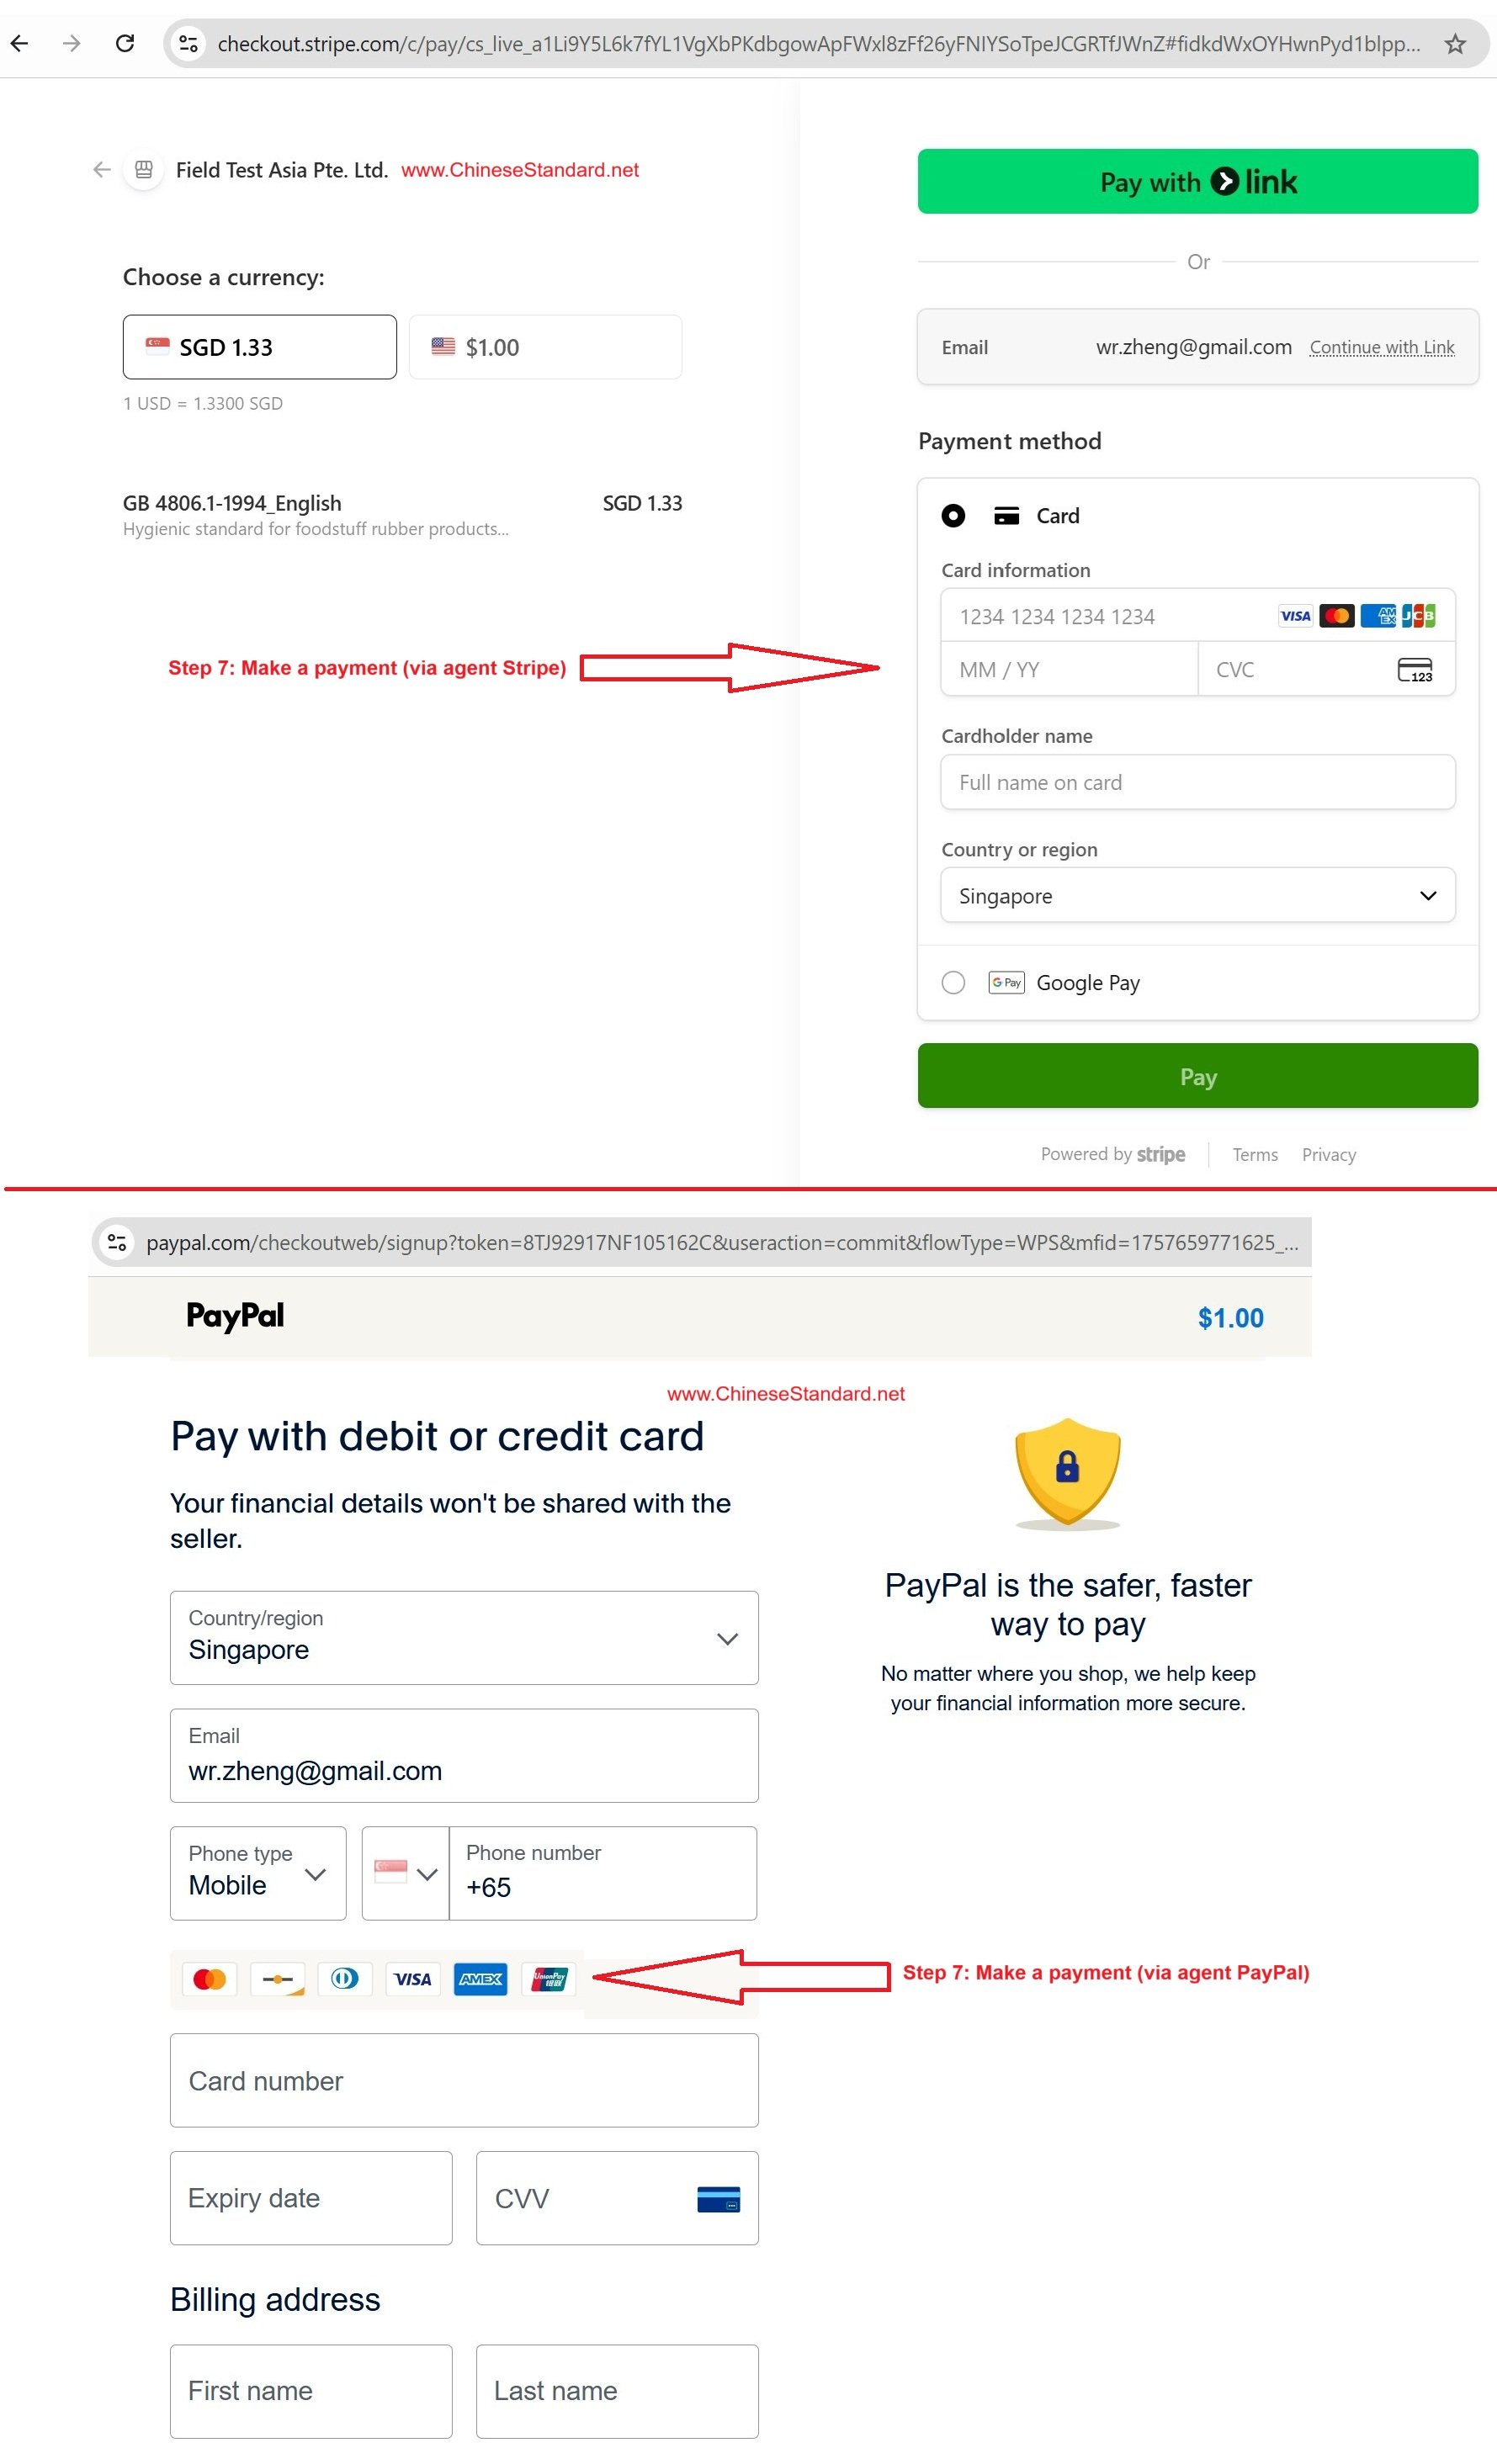
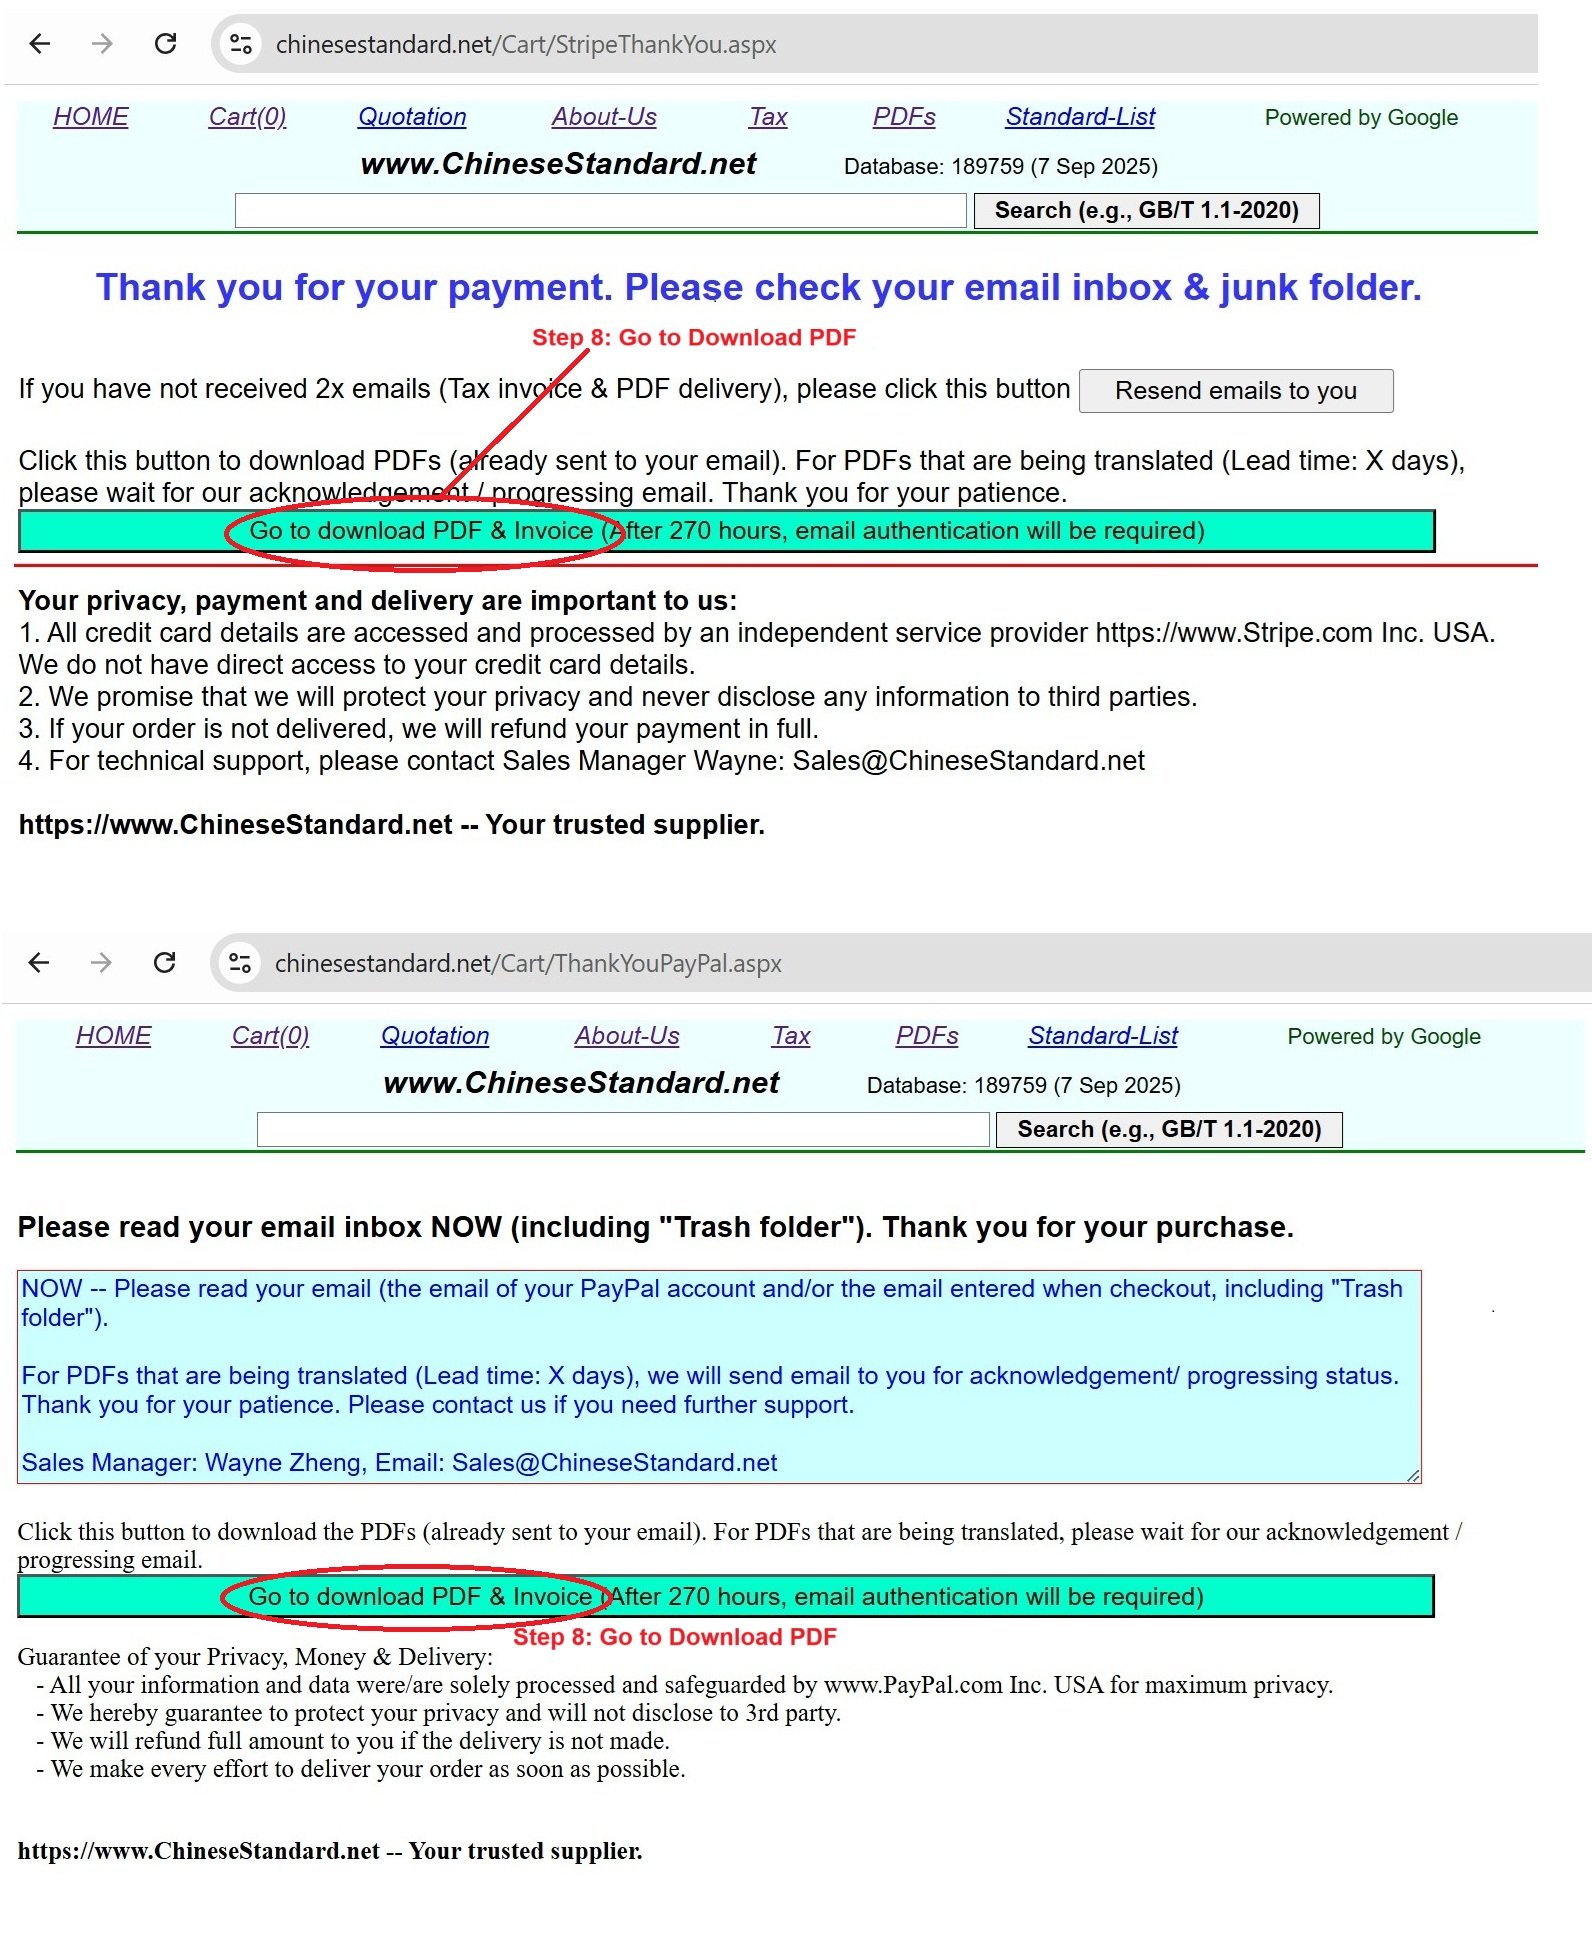
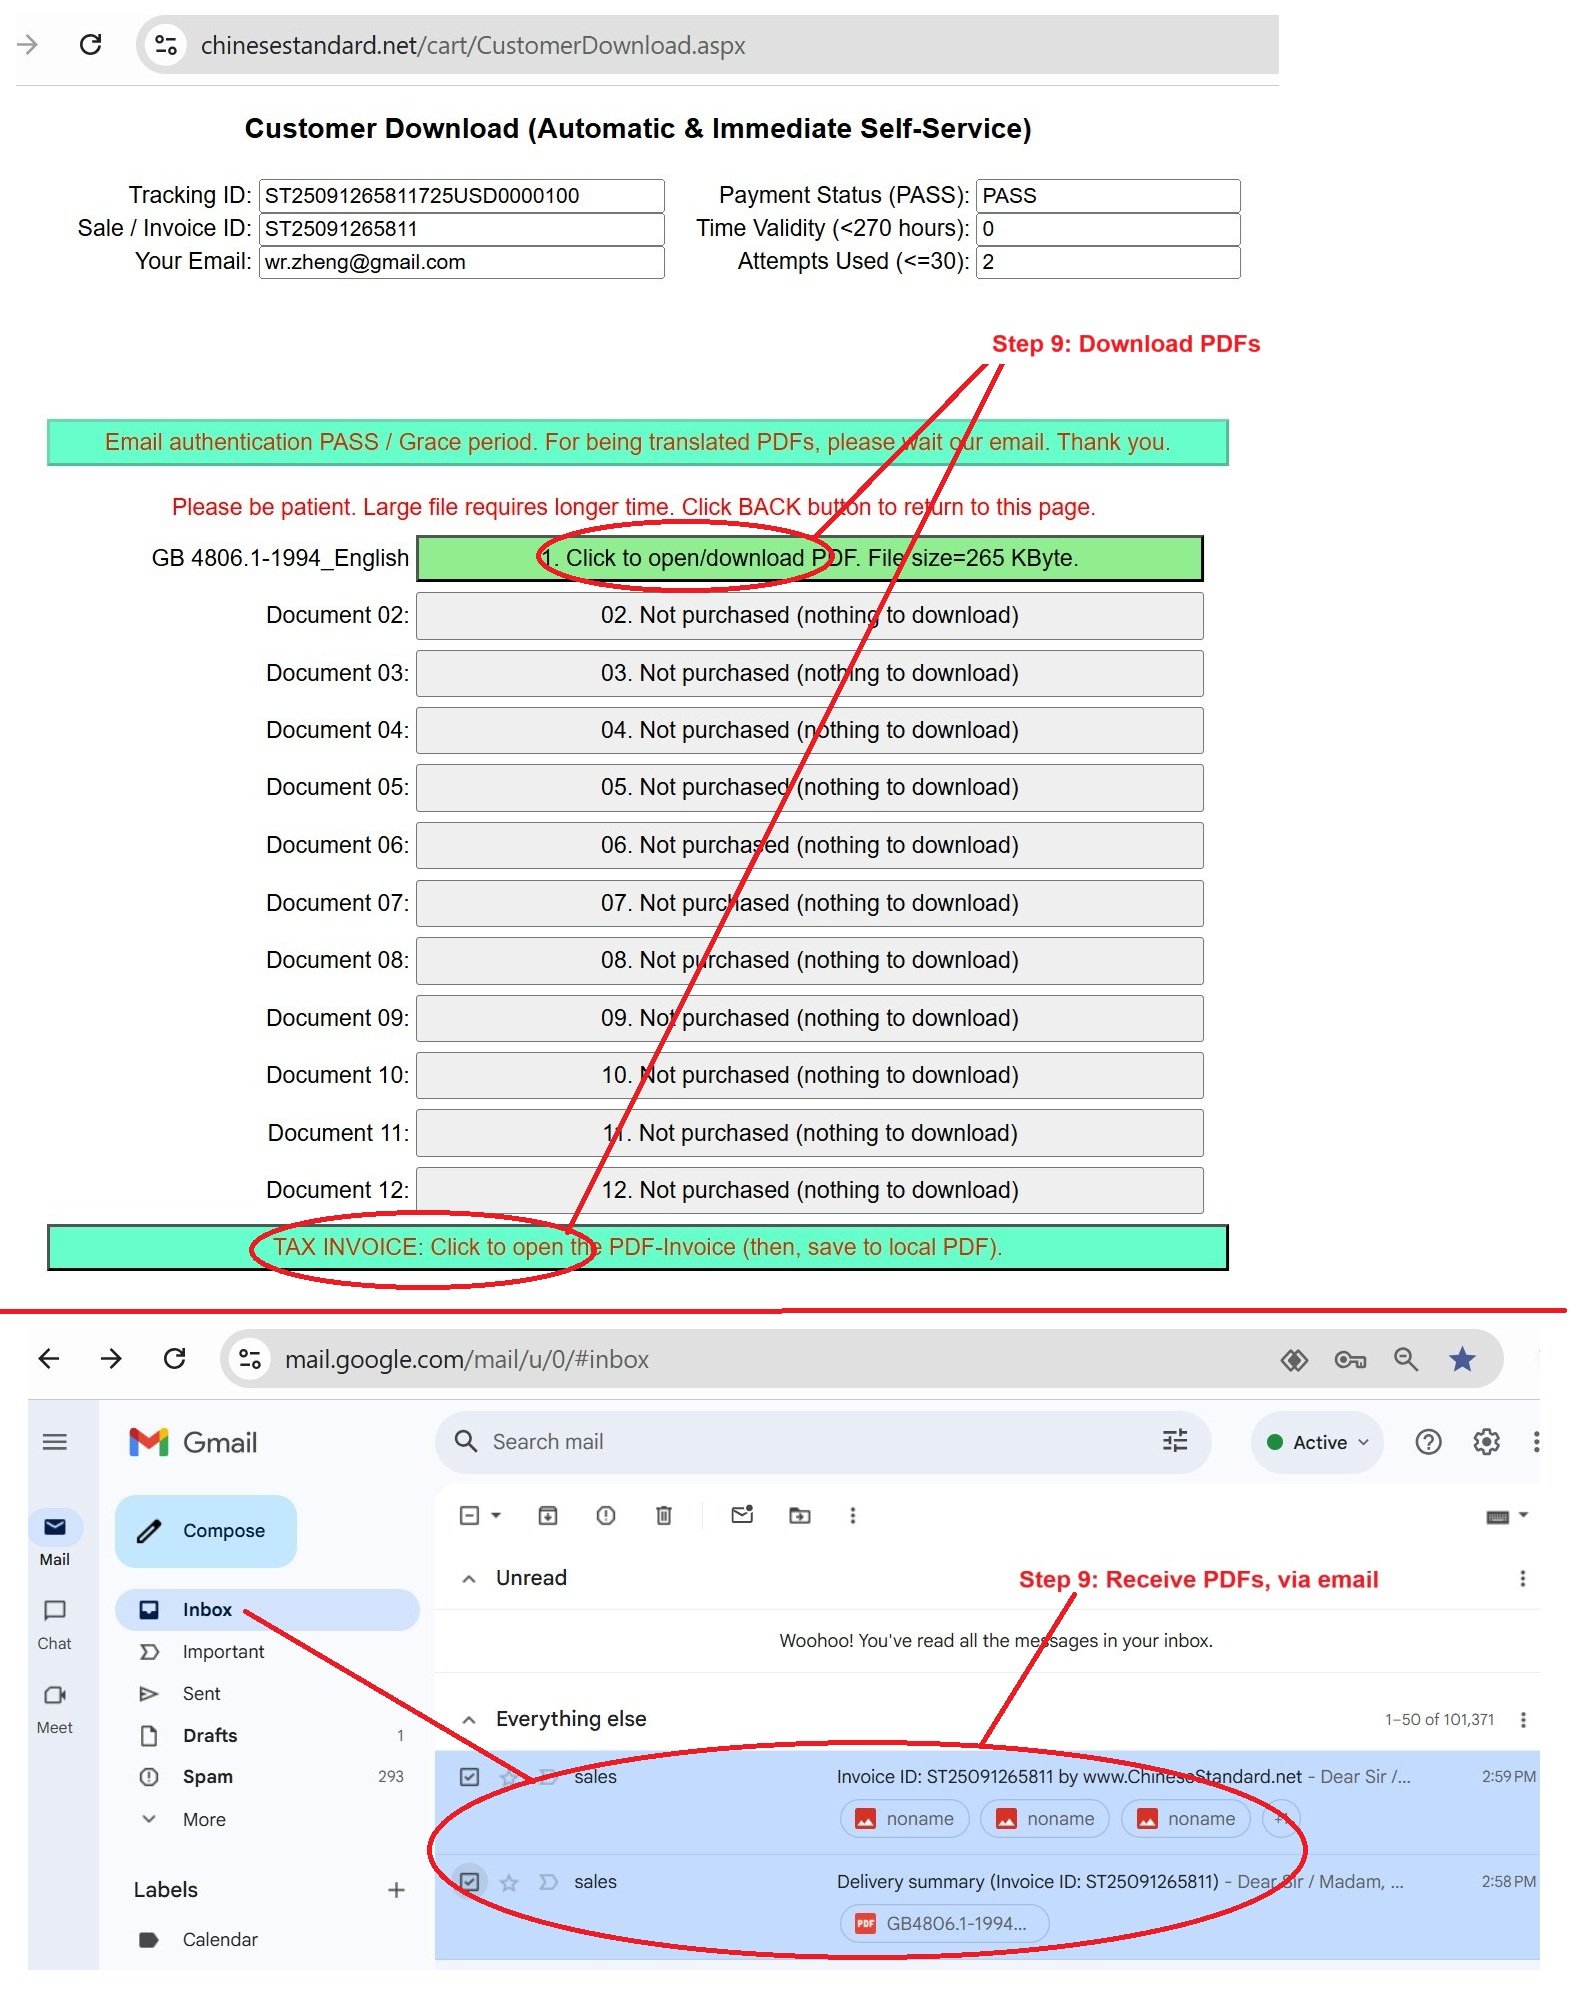
Similar standardsGB/T 36081-2018: Nanotechnology - Characterization of CdSe quantum dot nanocrystal - Fluorescence spectroscopy---This is an excerpt. Full copy of true-PDF in English version (including equations, symbols, images, flow-chart, tables, and figures etc.), auto-downloaded/delivered in 9 seconds, can be purchased online: https://www.ChineseStandard.net/PDF.aspx/GBT36081-2018 GB NATIONAL STANDARD OF THE PEOPLE’S REPUBLIC OF CHINA ICS 17.180 A 40 Nanotechnology - Characterization of CdSe quantum dot nanocrystal - Fluorescence spectroscopy Issued on: MARCH 15, 2018 Implemented on: OCTOBER 01, 2018 Issued by. General Administration of Quality Supervision, Inspection and Quarantine of PRC; National Standardization Administration. Table of ContentsForeword... 3 Introduction... 4 1 Scope... 5 2 Normative references... 5 3 Terms and definitions... 5 4 Method principle... 7 5 Instruments... 8 6 Samples... 8 7 Sample testing... 9 8 Testing report... 11 Appendix A (Informative) Testing of fluorescence emission spectra of CdSe quantum dot nanocrystals... 13 Appendix B (Informative) Measurement of relative fluorescence quantum yield of quantum dot nanocrystals... 15 Appendix C (Informative) Testing report of quantum dot nanocrystal fluorescence emission spectrum... 19 References... 20 Nanotechnology - Characterization of CdSe quantum dot nanocrystal - Fluorescence spectroscopy1 ScopeThis standard specifies the characterization method for the fluorescence emission spectrum detection of cadmium selenide quantum dot nanocrystals. This standard is applicable to the fluorescence emission spectrum characterization of cadmium selenide quantum dot nanocrystals; the fluorescence emission spectrum characterization of other nanomaterials can also refer to this standard.2 Normative referencesThe following documents are essential to the application of this document. For the dated documents, only the versions with the dates indicated are applicable to this document; for the undated documents, only the latest version (including all the amendments) is applicable to this standard. GB/T 19267.2 Physical and chemical examination of trace evidence in forensic sciences - Part 2.Ultraviolet-visible absorption spectroscopy GB/T 24370-2009 Nanotechnologies - Characterization of cadmium chalcogenide colloidal quantum dot - UV-Vis absorption spectroscopy GB/T 30544.1 Nanotechnologies - Vocabulary - Part 1.Core terms JJG 178 Verification regulation of ultraviolet, visible, near-infrared spectrophotometers JJG 537 Verification regulation of fluorescence spectrophotometer3 Terms and definitionsThe terms and definitions as defined in GB/T 30544.1, as well as the following terms and definitions, apply to this document. 3.1 Quantum dot nanocrystals5 Instruments5.1 UV-visible spectrophotometer Select a UV-visible spectrophotometer that complies with JJG 178, which has a wavelength range of 300 nm ~ 800 nm. 5.2 Fluorescence spectrophotometer Fluorescence spectrophotometer is also called fluorescence spectrometer. Select a fluorescence spectrophotometer that complies with JJG 537, which has an excitation wavelength range of 250 nm ~ 700 nm and an emission wavelength range of 300 nm ~ 950 nm. 5.3 Sample cell A quartz sample cell with two or four sides transparent for spectral detection in the ultraviolet and visible light regions, which has a 1 cm optical path. Note. The sample cell can be selected according to GB/T 9721. 5.4 Instrument calibration Depending on the instrument type, the detection instrument shall be verified/calibrated according to JJG 178, JJG 537 or tested according to GB/T 19267.2.6 Samples6.1 Sample preparation For the preparation method of cadmium selenide quantum dot nanocrystals, see Appendix B of GB/T 24370-2009.Cadmium selenide quantum dot nanocrystals need to be modified by specific surfactant molecules, before they can be uniformly dispersed in the solvent as experimental samples for UV-visible absorption spectrum and fluorescence emission spectrum detection. The surface ligands of cadmium selenide quantum dot nanocrystals prepared by high-temperature oil phase pyrolysis are aliphatic hydrocarbon molecules, which can be uniformly dispersed in non-polar organic solvents such as n-hexane, toluene, dichloroethane. 6.2 Test sample requirements The quantum dot samples to be measured shall be uniformly dispersed in a suitable solvent, to form a clear and transparent sol.7 Sample testing7.1 UV-visible absorption spectrum Use a UV-visible spectrophotometer to detect the UV-visible absorption spectrum of the cadmium selenide quantum dot nanocrystal test sample 1). Mark 450 nm and the band edge absorption peak wavelength (λabs) and the corresponding absorbance on the measured UV-visible absorption spectrum line. The absorbance of the test sample used to test the fluorescence emission spectrum at the selected excitation wavelength shall be less than 0.05; the recommended absorbance is between 0.03 and 0.05. 7.2 Fluorescence emission spectrum 7.2.1 Selection of fluorescence excitation wavelength Use a fluorescence spectrophotometer to detect the fluorescence emission spectrum of the test sample in 7.1. When detecting the fluorescence emission spectrum, the excitation wavelength (λex) is recommended to be selected as follows. a) For quantum dot test samples intended for photoelectric conversion (especially in the display field), select 450 nm as the excitation wavelength; b) For test samples intended for biomedicine or other research or application fields, any wavelength within the wavelength range of (λabs - 150, λabs - 30) nm can be selected as the excitation wavelength; (λabs - 60) nm is recommended. 7.2.2 Test conditions The following test conditions are recommended. a) Fluorescence excitation wavelength (λex). λ nm; b) Fluorescence emission wavelength (λem) range. (λ + 15, λ + 200) nm)2); c) Slit width. 5 nm or 10 nm; d) Temperature. 23 °C ± 2 °C. 7.2.3 Test steps 1 For test samples, test conditions, test steps, please refer to GB/T 24370-2009. 2 To avoid the influence of the double frequency peak, the maximum value of the fluorescence emission wavelength range is usually less than 2 times the excitation wavelength. d) Temperature. 23 °C ± 2 °C. 7.3.3 Test steps The test steps for fluorescence excitation spectrum are as follows. a) Add 2.5 mL of test sample to a quartz sample cell with four transparent sides; cover it; b) Place the sample cell in the sample slot; apply the instrument sample compartment cover to ensure good sealing and opaqueness; c) Set the emission wavelength, excitation wavelength range, slit width, scanning speed and other parameters; d) Start scanning to obtain the fluorescence excitation spectrum of the test sample; e) Mark the fluorescence excitation wavelength on the fluorescence excitation spectrum line. For the detection example of cadmium selenide quantum dot fluorescence emission spectrum, please refer to Appendix A. For the measurement of relative fluorescence quantum yield of quantum dot nanocrystals, please refer to Appendix B.8 Testing reportThe testing report of quantum dot nanocrystal fluorescence emission spectrum shall include the following. a) Test sample. 1) Test sample name; 2) Solvent. b) Test conditions. 1) Instrument model (UV-visible spectrophotometer, fluorescence spectrophotometer); 2) Test parameters (sample cell, excitation wavelength, emission wavelength range, slit width, testing temperature). c) Test results. 1) UV-visible absorption spectrum of the test sample; 2) Fluorescence emission spectrum of the test sample;Appendix B(Informative) Measurement of relative fluorescence quantum yield of quantum dot nanocrystals B.1 Overview Fluorescence quantum yield indicates the ability of a substance to emit fluorescence. According to different measurement methods, it can be divided into relative fluorescence quantum yield and absolute fluorescence quantum yield. The absolute fluorescence quantum yield can be directly measured by a calibrated steady- state/transient fluorescence spectrometer, whilst the relative fluorescence quantum yield needs to be detected and calculated using a fluorescent standard substance as a reference sample. B.2 Relative fluorescence quantum yield The measurement of relative fluorescence quantum yield requires a dilute solution of fluorescent nanomaterials as the sample to be measured. Use UV-visible spectrophotometer to test the absorbance of fluorescent standard substance and test sample at the excitation wavelength, so that the absorbance (OD value) is not greater than 0.05 4). Use fluorescence spectrophotometer to measure the fluorescence emission spectrum of fluorescent standard substance and test sample; calculate the relative fluorescence quantum yield of test sample. When measuring relative fluorescence quantum yield, the selection of the fluorescence standard substance as a reference shall meet the following conditions. a) It has a fluorescence excitation wavelength similar to that of the quantum dot sample being measured; b) It has a fluorescence quantum yield equivalent to or higher than that of the quantum dot sample being measured; c) It has a fluorescence emission wavelength as close as possible to that of the quantum dot sample being measured; d) The fluorescence properties of the fluorescence standard substance have been fully characterized and the fluorescence quantum yield is known. 4 When the OD value is not greater than 0.05, the Beer-Lambert law can be applied. If the OD value is greater than 0.05, the nonlinearity of the Beer-Lambert law will be caused due to excessive concentration (including reabsorption effect). spectrum measurement; use the above dilute solution or solvent to adjust the concentration of the fluorescent standard substance in the sample cell, so that the OD value corresponding to the excitation wavelength of the final sample is 0.05 6). Detect the fluorescence emission spectrum of the final sample. B.3.3 Establishment of the calibration curve of fluorescence standard substance According to the OD value of the fluorescence standard substance at the excitation wavelength and the volume of the dilute solution taken, prepare a series of dilute solutions of fluorescence standard substances with OD values of 0.001, 0.003, 0.005, 0.01, 0.03, 0.05 corresponding to the excitation wavelength. The light intensity of this series and the corresponding integrated fluorescence emission intensity will be used to establish a calibration curve, for measuring the relative fluorescence quantum yield. Refer to 7.1 and 7.2, to detect the UV-visible absorption spectrum and fluorescence emission spectrum of the above series of dilute solutions of fluorescence standard substances. Use the absorbance corresponding to the excitation wavelength as the x- axis and the integrated fluorescence intensity as the y-axis, to establish the calibration curve of the fluorescence standard substance. B.3.4 Measurement of relative fluorescence quantum yield of quantum dots Detect the fluorescence emission spectrum of the quantum dot nanocrystal test sample according to 7.2.Prepare a series of test sample solutions with different OD values at the excitation wavelength. Record the OD value of the test sample at the excitation wavelength. Detect the fluorescence emission spectrum of each test sample. Calculate the integrated area of the fluorescence emission peak of the test sample corresponding to different OD values. Use the absorbance corresponding to the excitation wavelength as the x-axis and the integrated fluorescence intensity as the y-axis, to establish a linear regression curve of the tested sample. Calculate the relative fluorescence quantum yield of the test sample according to formula (B.2). Note that the relative fluorescence quantum yield obtained here is the actual test sample rather than the relative fluorescence quantum yield of the sample before dilution. B.4 Sources of measurement uncertainty The measurement of the fluorescence characteristics of fluorescent nanomaterials is affected by the testing instrument, testing condition parameters, operation of the test personnel. The composition of the measurement uncertainty of the fluorescence quantum yield is also related to the testing method. It is recommended to refer to ISO/IEC Guide 98-3 for the evaluation of measurement uncertainty. 6 This concentration will be used as the maximum concentration when establishing the fluorescence spectrum calibration curve of the fluorescence standard substance. The OD value equal to 0.05 can ensure that the nonlinear response of the fluorescence spectrophotometer detector, such as saturation, is avoided when testing the fluorescence emission spectrum. ......Source: Above contents are excerpted from the full-copy PDF -- translated/reviewed by: www.ChineseStandard.net / Wayne Zheng et al. Tips & Frequently Asked Questions:Question 1: How long will the true-PDF of English version of GB/T 36081-2018 be delivered?Answer: The full copy PDF of English version of GB/T 36081-2018 can be downloaded in 9 seconds, and it will also be emailed to you in 9 seconds (double mechanisms to ensure the delivery reliably), with PDF-invoice.Question 2: Can I share the purchased PDF of GB/T 36081-2018_English with my colleagues?Answer: Yes. The purchased PDF of GB/T 36081-2018_English will be deemed to be sold to your employer/organization who actually paid for it, including your colleagues and your employer's intranet.Question 3: Does the price include tax/VAT?Answer: Yes. Our tax invoice, downloaded/delivered in 9 seconds, includes all tax/VAT and complies with 100+ countries' tax regulations (tax exempted in 100+ countries) -- See Avoidance of Double Taxation Agreements (DTAs): List of DTAs signed between Singapore and 100+ countriesQuestion 4: Do you accept my currency other than USD?Answer: Yes. www.ChineseStandard.us -- GB/T 36081-2018 -- Click this link and select your country/currency to pay, the exact amount in your currency will be printed on the invoice. Full PDF will also be downloaded/emailed in 9 seconds.How to buy and download a true PDF of English version of GB/T 36081-2018?A step-by-step guide to download PDF of GB/T 36081-2018_EnglishStep 1: Visit website https://www.ChineseStandard.net (Pay in USD), or https://www.ChineseStandard.us (Pay in any currencies such as Euro, KRW, JPY, AUD).Step 2: Search keyword "GB/T 36081-2018". Step 3: Click "Add to Cart". If multiple PDFs are required, repeat steps 2 and 3 to add up to 12 PDFs to cart. Step 4: Select payment option (Via payment agents Stripe or PayPal). Step 5: Customize Tax Invoice -- Fill up your email etc. Step 6: Click "Checkout". Step 7: Make payment by credit card, PayPal, Google Pay etc. After the payment is completed and in 9 seconds, you will receive 2 emails attached with the purchased PDFs and PDF-invoice, respectively. Step 8: Optional -- Go to download PDF. Step 9: Optional -- Click Open/Download PDF to download PDFs and invoice. See screenshots for above steps: Steps 1~3 Steps 4~6 Step 7 Step 8 Step 9 |